
- Kenon Holdings (KEN) is trading at a new three-year high and has strong technical momentum.
- KEN has surged 94% over the past year and offers a 8.54% dividend.
- Shares have a 100% “Buy” opinion from Barchart.
- Despite the technical strength, Wall Street sentiment is lukewarm. Extreme caution and disciplined risk management are strongly advised before considering this stock.
Author’s Note: Before you get too deep into today’s Chart of the Day, I’d like to point out that this stock is featured only because of its technical indicators. Value Line cautions this stock has low price stability and extremely low earnings predictability. I agree with this warning of caution.
Today’s Featured Stock
Valued at $2.9 billion, Kenon Holdings (KEN) is a holding company. It owns, develops and operates power generation facilities through its subsidiaries.
What I’m Watching
I found today’s Chart of the Day by using Barchart’s powerful screening functions to sort for stocks with the highest technical buy signals; superior current momentum in both strength and direction; and a Trend Seeker “buy” signal. I then used Barchart’s Flipcharts feature to review the charts for consistent price appreciation. KEN checks those boxes. Since the Trend Seeker signaled a new “Buy” on Oct. 8, the stock has gained 18.22%.
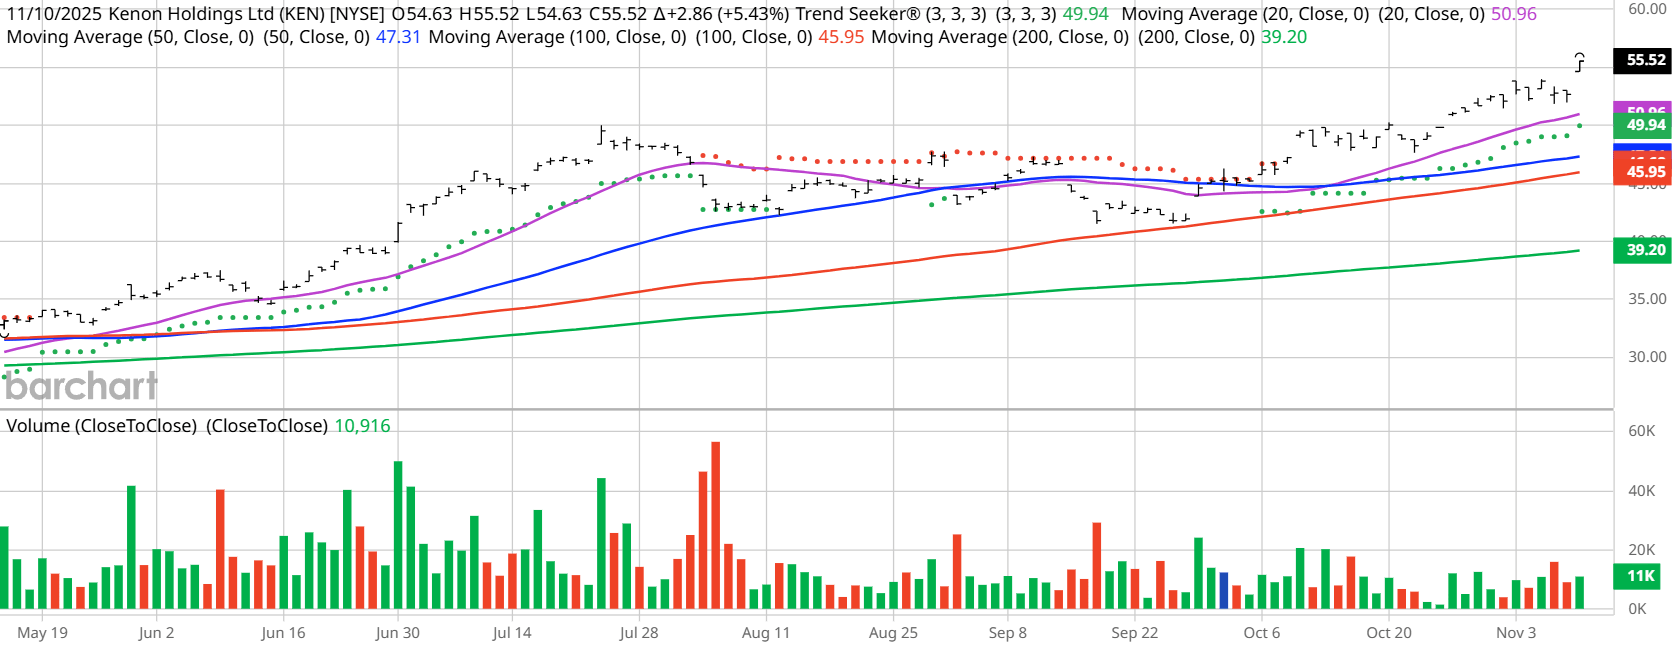
Barchart Technical Indicators for Kenon Holdings
Editor’s Note: The technical indicators below are updated live during the session every 20 minutes and can therefore change each day as the market fluctuates. The indicator numbers shown below therefore may not match what you see live on the Barchart.com website when you read this report. These technical indicators form the Barchart Opinion on a particular stock.
Kenon hit a three-year high of $56.20 in morning trading on Nov. 11.
- KEN has a Weighted Alpha of +101.52.
- Kenon has a 100% “Buy” opinion from Barchart.
- The stock gained 94.15% over the past year.
- KEN has its Trend Seeker “Buy” signal intact.
- The stock recently traded at $55.31 with a 50-day moving average of $47.55.
- Kenon has made 11 new highs and gained 15.82% in the last month.
- Relative Strength Index (RSI) is at 70.51.
- There’s a technical support level around $54.93.
Don’t Forget the Fundamentals
- $2.9 billion market capitalization.
- 8.54% dividend yield.
- Earnings are estimated to increase 10.77% this year and an additional 13.88% next year.
Analyst and Investor Sentiment on Kenon Holdings
I don’t buy stocks because everyone else is buying, but I do realize that if major firms and investors are dumping stock, it’s hard to make money swimming against the tide.
It looks like no one is sticking their neck out on this one despite its technical price movement.
- Wall Street analysts tracked by Barchart do not cover the stock.
- Value Line rates the stock technically “Above Average” but has the caution I noted above.
- CFRA’s MarketScope Advisor does not rate the stock.
- Morningstar thinks the stock’s recent runup makes it 19% overvalued.
- No one is following the stock on Motley Fool
- 1,580 investors monitor the stock on Seeking Alpha, which does not rate this stock.
The Bottom Line on Kenon Holdings
The stock is a total speculative technical play based on price movement only. CAVEAT EMPTOR… in all caps!
Today’s Chart of the Day was written by Jim Van Meerten. Read previous editions of the daily newsletter here.
Additional disclosure: The Barchart of the Day highlights stocks that are experiencing exceptional current price appreciation. They are not intended to be buy recommendations as these stocks are extremely volatile and speculative. Should you decide to add one of these stocks to your investment portfolio it is highly suggested you follow a predetermined diversification and moving stop loss discipline that is consistent with your personal investment risk tolerance.
On the date of publication, Jim Van Meerten did not have (either directly or indirectly) positions in any of the securities mentioned in this article. All information and data in this article is solely for informational purposes. For more information please view the Barchart Disclosure Policy here.
More news from Barchart
- Alphabet Generates Strong FCF and If It Continues GOOGL Stock is 40% Undervalued
- Is Owens & Minor’s New Focus Enough to Lift Its Shares From the Bottom 100?
- SPY’s 50-Day Moving Average Streak is Going Strong. The Rest of the Market is Sending Up Flares.
- This ‘Strong Buy’ Tech Stock Just Inked a Deal with AWS. Should You Buy It Now?


