According to a 2026 Searchlab report, 67% of businesses now use AI. However, SR Analytics reports that 61% of business intelligence AI initiatives fail to generate any measurable profit impact.
This disconnect between rapid adoption and successful outcomes is often caused by poor integration, fragmented data systems, and weak technical foundations.
To help close that gap, this article explores the top business intelligence programs designed to improve data management, streamline enterprise operations, and deliver actionable insights that drive real business results.
How We Selected These Top Business Intelligence Courses
- We prioritized curricula teaching practical application rather than high-level data theory.
- The content aligns directly with specific APIs and dashboard frameworks used by engineering teams in 2026.
- The taught skills match the exact technical requirements demanded by current U.S. employers.
- We selected instruction strictly from verified enterprise leaders and established tech education platforms.
- Every program requires you to complete applied data exercises and build functional visualization workflows.
Overview: Best Business Intelligence Courses for 2026
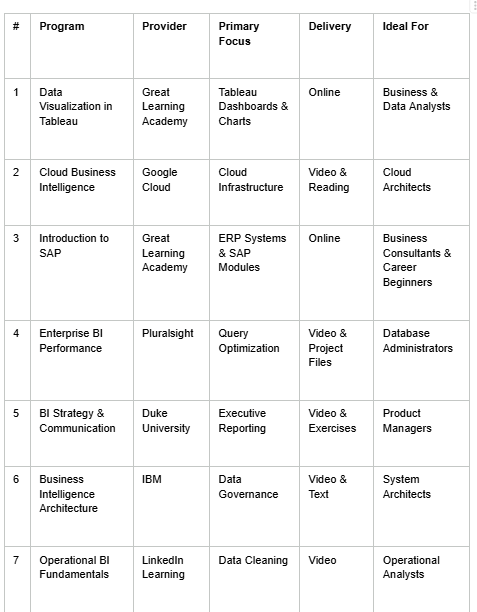
7 Best Free Courses for Learning Tableau Analytics and SAP Fundamentals in 2026
1. Data Visualization in Tableau — Great Learning Academy
This free tableau course by Great Learning Academy teaches the basics of creating impactful data visualizations and dashboards using Tableau.
Learners will explore data connections, chart creation, and interactive reporting techniques used in modern businesses.
- Delivery & Duration: Online, self-paced (about 3 hours)
- Credentials: Certificate of Completion from Great Learning
- Instructional Quality & Design: Easy-to-follow video tutorials showing step-by-step navigation, data connection, and chart creation directly inside the Tableau software.
- Support: Learn at your own pace with lifetime access to the course materials.
Key Outcomes / Strengths
- Understand the basics of data visualization and why it matters in the business world
- Learn how to easily connect, load, and prepare datasets for analysis inside Tableau
- Build common visual charts like bar graphs, scatter plots, maps, and line charts
- Combine multiple charts to create interactive, professional-looking data dashboards
2. Cloud Business Intelligence — Google Cloud
The course explains large-scale data warehousing using BigQuery and Looker. It targets cloud architects migrating on-premise databases to cloud infrastructure.
The curriculum prioritizes server planning over manual chart design. Expect zero coding exercises throughout the entire syllabus.
- Delivery & Duration: On-demand video and reading materials; 1 week
- Credentials: Google Cloud Skill Badge
- Instructional Quality & Design: The instruction relies on concise animated videos and technical documentation. You complete multiple-choice knowledge checks to verify comprehension. There are no interactive coding labs.
- Support: A community forum allows peers to discuss concepts. Google Cloud engineers do not monitor the discussion boards.
Key Outcomes / Strengths
- Evaluation matrices comparing data warehouse solutions
- Architecture diagrams mapping cloud storage networks
- Resource planning models estimating server costs
- Tuning strategies accelerating query responses
3. Introduction to SAP — Great Learning Academy
This free SAP certification course from Great Learning Academy is a great starting point for beginners looking to understand the fundamentals of SAP and Enterprise Resource Planning (ERP).
It introduces key SAP modules and explains how organizations use the platform to streamline business processes, improve efficiency, and enable real-time collaboration across departments.
- Delivery & Duration: Online, self-paced (about 2 hours)
- Credentials: Certificate of Completion from Great Learning
- Instructional Quality & Design: Clear, easy-to-understand video lessons that break down complex business software concepts into simple terms.
- Support: Learn at your own pace with lifetime access to the course materials.
Key Outcomes / Strengths
- Understand the basics of Enterprise Resource Planning (ERP) and what SAP actually does
- Learn about the core SAP modules (like Finance, HR, and Materials Management) and how they work
- Discover how businesses use SAP to connect different departments and share data in real-time
- Build the foundational knowledge needed to explore careers in SAP administration or business consulting
4. Enterprise BI Performance — Pluralsight
The course covers DAX optimization and rendering speed for Power BI deployments. It serves database administrators running high-volume reporting networks.
The material prioritizes query load reduction over aesthetic design choices. Expect no beginner concepts.
- Delivery & Duration: On-demand video and downloadable project files; 2 weeks
- Credentials: Pluralsight Certificate of Completion
- Instructional Quality & Design: You watch screen-capture walkthroughs of complex architectural failures. You then observe the subsequent performance optimizations. You download the project files and test the configurations locally on your machine.
- Support: No direct support exists. You must rely on external developer communities.
Key Outcomes / Strengths
- System diagrams detailing report caching workflows
- DAX formulas processing millions of data rows
- Performance recording dashboards identifying slow queries
- Data source filters restricting unauthorized access
5. BI Strategy & Communication — Duke University
The course explores principles of visual perception and executive data storytelling. It targets corporate product managers evaluating complex performance metrics.
The instruction enforces strict guidelines for presenting financial data to avoid misleading stakeholders. You will complete very few software exercises.
- Delivery & Duration: On-demand video and interactive assignments; 4 weeks
- Credentials: Duke University Shareable Certificate
- Instructional Quality & Design: Instructors guide you through recorded presentations, evaluating historical financial reports. You download public data sets and redesign misleading visualizations locally. You submit your final dashboard for peer evaluation.
- Support: A peer review system handles assignment grading. University teaching assistants occasionally monitor the forums.
Key Outcomes / Strengths
- Rubrics identifying biased data representations
- Dashboard layout templates optimizing viewer attention
- Colorblind-friendly design strategies
- Evaluation matrices matching charts to business goals
6. Business Intelligence Architecture — IBM
The course details data governance and security protocols across massive data lakes. System architects managing private customer information will benefit most.
The curriculum enforces strict privacy constraints rather than casual visual exploration. Expect heavy theoretical reading without interactive coding assignments.
- Delivery & Duration: On-demand video and text modules; 3 weeks
- Credentials: IBM Shareable Certificate
- Instructional Quality & Design: The material relies heavily on detailed architectural diagrams mapping secure networks. You configure access permissions rather than designing front-end charts. The platform structures all learning modules around real-world banking case studies.
- Support: A peer review system handles assignment grading. Instructor feedback is unavailable.
Key Outcomes / Strengths
- Row-level security protocols prevent data leakage
- Architecture diagrams mapping private server implementation
- User group configurations managing restricted access
- Cost estimation models projecting enterprise licensing fees
7. Operational BI Fundamentals — LinkedIn Learning
The course details automated data cleaning workflows for daily operational reporting. It serves operational analysts dealing with messy, unstructured text files.
The instruction strictly focuses on pre-visualization data shaping. The material is extremely brief.
- Delivery & Duration: On-demand video lectures; 2 hours
- Credentials: LinkedIn Learning Certificate
- Instructional Quality & Design: You watch tightly edited videos demonstrating data flow constructions on screen. The instructor shares the raw data files for download. There are no mandatory interactive exercises.
- Support: You can ask questions in the course Q&A tab. The instructor occasionally replies to highly upvoted questions.
Key Outcomes / Strengths
- Cleaning steps standardize inconsistent text entries
- Union operators combining multiple daily spreadsheets
- Pivot operations reshaping cross-tabulated metrics
- Automated output steps pushing clean data to servers
Final Thoughts
The best course depends on your role and objectives. Interactive platforms are useful for creating reports and dashboards, while university programs strengthen communication and leadership skills.
For technical professionals, cloud-focused training provides deeper expertise in data infrastructure.
The Top 7 Business Intelligence Courses for Data and Enterprise Operations in 2026 can help you develop the skills needed to make informed, data-driven decisions.