- Revenue of $56 million, up 21% Y/Y -
- Gross mining margin of 47%, down from 57% from Q4 2023 -
- 18.6 EHuM up 186% from Q4 2023-
- Current efficiency of 19w/TH a 45% improvement from Q4 2023-
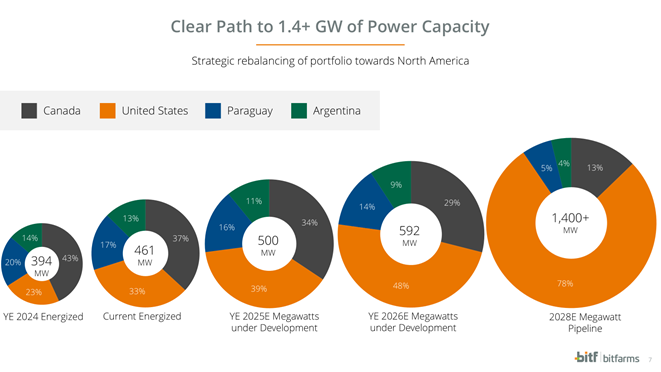
-Total energy pipeline of ~1.4 GW, ~80% based in the U.S.-
-Completed acquisition of Stronghold Digital Mining & sale of Yguazu, Paraguay data center-
This news release constitutes a “designated news release” for the purposes of the Company’s second amended and restated prospectus supplement dated December 17, 2024, to its short form base shelf prospectus dated November 10, 2023.
TORONTO, Ontario and BROSSARD, Québec, March 27, 2025 (GLOBE NEWSWIRE) -- Bitfarms Ltd. (Nasdaq/TSX: BITF), a global vertically integrated Bitcoin data center company, reported its financial results for the fourth quarter ended December 31, 2024. All financial references are in U.S. dollars.
CEO Ben Gagnon stated, “Bitfarms is a completely different company than we were at the beginning of 2024. Across nearly every metric, we have rapidly transformed from the international Bitcoin miner to a North American energy and compute company. We now have one of the largest portfolios of flexible MW in the PJM market among Bitcoin miners and are well-positioned to capitalize on macro tailwinds and surging demand for U.S. power and infrastructure. From January 2024, we’ve grown our energized capacity over 90% to 461 MW and secured a multi-year pipeline of over 1.4 GW, nearly 80% of which is based in the U.S and over 90% of which is based in North America.
“Just last week, we closed both the transformative acquisition of Stronghold Digital Mining, the largest M&A deal between two public miners in our industry, and the strategic sale of our 200 MW Yguazu data center, our largest constructed site. Thus far this quarter, we advanced our HPC/AI strategy with the engagement of two new advisors, hired two new critical team members, an SVP of HPC and an SVP of Infrastructure, and significantly improved our hashrate, reaching 18.6 EHuM, which we expect will generate operating cash flow through 2026 and beyond.
“While we remain confident in the significant upside potential of our BTC mining operations and continue to maximize the value of our assets, our revenue diversification strategy—both in the U.S. and with HPC/AI—is geared toward driving greater shareholder value. We aim to secure long-term, predictable cash flows from a well-capitalized HPC/AI customer, while diversifying our revenue streams, reducing our dependency on BTC price volatility, and capitalizing on the growing demand for AI computing. Our two recent strategic transactions, the Stronghold acquisition and the Yguazu data center sale, demonstrate execution of this strategy," concluded Mr. Gagnon.
SVP of Mining Operations Alex Brammer stated, “We’ve made significant progress with our mining operations over the past year, nearly tripling our hashrate and improving our efficiency by over 40%. This momentum continues to accelerate. In the last three months alone, we grew our hashrate over 40% to 18.6 EH/s and reached our first half efficiency target of 19 w/TH three months ahead of schedule. This was achieved through the energization of two North American sites, new miner deliveries and continued optimizations across all of our sites.”
CFO Jeff Lucas stated, “The recent acquisition of Stronghold and sale of Yguazu have expanded our growth opportunities and strengthened our financial profile. Our identified capex requirements for 2025 are now 20% lower than previously planned and we have no plans for large miner purchases in 2025 or 2026; instead, we will be deploying this capital towards developing U.S. energy and HPC infrastructure. We expect that this shift in our strategy will enable us to raise capital more cost-effectively and to secure steadier earnings streams and greater operating margins, the culmination of which we expect will drive long-term shareholder value.”
Anticipated Megawatt Growth
Mining Operations
- Current hashrate of 18.6 EHuM, up from 6.5 EHuM in Q4 2023
- Current efficiency of 19 w/TH, a 45% improvement from Q4 2023
Recent Strategic Developments
- Completed previously announced acquisition of Stronghold Digital Mining, Inc.
- Completed previously announced sale of 200 MW data center in Yguazu, Paraguay to HIVE Digital Technologies
- Secured two strategic partners, ASG and World Wide Technology, to advance HPC/AI business
- Strengthened Management team with two new strategic hires, James Bond, SVP of HPC/AI, and Craig Hibbard, SVP of Infrastructure
- Initiated Bitcoin One program following the success of Synthetic HODL program in 2024, which achieved a 135% return since the program's inception in Q4 2023 through December 31, 2024.
Q4 2024 Financial Highlights
- Total revenue of $56 million, up 21% Y/Y
- Gross mining margin of 47%, down from 57% in Q4 2023
- General and administrative expenses of $18 million, compared to $13 million in Q4 2023
- Operating loss of $16 million compared to an operating loss of $13 million in Q4 2023
- Net income of $15 million, or $0.03 per basic and diluted share compared to a net loss of $62 million or $0.21 per basic and diluted share in Q4 2023
- Adjusted EBITDA* of $14 million, or 25% of revenue, down from $16 million or 35% of revenue in Q4 2023
- The Company earned 654 BTC at an average direct cost of production per BTC* of $40,800
- Total cash cost of production per BTC* was $60,800 in Q4 2024
Liquidity**
As of March 26, 2025, the Company had total liquidity of approximately $135 million.
Q4 2024 and Recent Financing Activities
- Sold 502 BTC at an average price of $81,400 for total proceeds of $41 million in Q4 2024 and sold 117 of the 414 BTC earned during January and February 2025, generating total proceeds of $11 million. A portion of the funds was used to pay capital expenditures to support the Company’s growth and efficiency improvement objectives.
- As of March 26, 2025, the Company held 1,093 Bitcoin.
- Raised $50 million in net proceeds during Q4 2024 bringing the total net proceeds to $314 million through March 26, 2025 under the Company's 2024 at-the-market equity offering program.
| Quarterly Operating Performance | |||
| Q4 2024 | Q3 2024 | Q4 2023 | |
| Total BTC earned | 654 | 703 | 1,236 |
| Average Watts/Average TH efficiency*** | 22 | 23 | 35 |
| BTC sold | 502 | 461 | 1,135 |
| As of December 31, | As of September 30, | As of December 31, | |
| 2024 | 2024 | 2023 | |
| Operating EH/s | 12.8 | 11.3 | 6.5 |
| Operating capacity (MW) | 394 | 310 | 240 |
| Quarterly Average Revenue**** and Cost of Production per BTC* | ||||||||||
| Q4 2024 | Q3 2024 | Q2 2024 | Q1 2024 | Q4 2023 | ||||||
| Avg. Rev****/BTC | $82,400 | $60,900 | $65,800 | $52,400 | $36,400 | |||||
| Direct Cost*/BTC | $40,800 | $36,600 | $30,600 | $18,400 | $14,400 | |||||
| Total Cash Cost*/BTC | $60,800 | $53,700 | $47,600 | $27,900 | $23,300 | |||||
* Gross mining profit, gross mining margin, EBITDA, EBITDA margin, Adjusted EBITDA, Adjusted EBITDA margin, Direct Cost per BTC and Total Cash Cost per BTC are non-IFRS financial measures or ratios and should be read in conjunction with, and should not be viewed as alternatives to or replacements of measures of operating results and liquidity presented in accordance with IFRS. Readers are referred to the reconciliations of non-IFRS measures included in the Company’s MD&A and at the end of this press release.
** Liquidity represents cash and balance of unrestricted digital assets.
*** Average watts represent the energy consumption of miners.
**** Average revenue per BTC is for mining operations only and excludes Volta revenue.
Conference Call
Management will host a conference call today at 8:00 am EST. All Q4 2024 materials will be available before the call and can be accessed on the ‘Financial Results’ section of the Bitfarms investor site.
The live webcast and a webcast replay of the conference call can be accessed here. To access the call by telephone, register here to receive dial-in numbers and a unique PIN to join the call.
Non-IFRS Measures*
As a Canadian company, Bitfarms follows International Financial Reporting Standards (IFRS) which are issued by the International Accounting Standard Board (IASB). Under IFRS rules, the Company does not reflect the revaluation gains on the mark-to-market of its Bitcoin holdings in its income statement. It also does not include the revaluation losses on the mark-to-market of its Bitcoin holdings in Adjusted EBITDA, which is a measure of the cash profitability of its operations and does not reflect the change in value of its assets and liabilities.
The Company uses Adjusted EBITDA to measure its operating activities' financial performance and cash generating capability.
About Bitfarms Ltd.
Founded in 2017, Bitfarms is a global Bitcoin data center company that contributes its computational power to one or more mining pools from which it receives payment in Bitcoin. Bitfarms develops, owns, and operates vertically integrated mining farms with in-house management and company-owned electrical engineering, installation service, and multiple onsite technical repair centers. The Company’s proprietary data analytics system delivers best-in-class operational performance and uptime.
Bitfarms currently has 15 operating Bitcoin data centers and two under development situated in four countries: Canada, the United States, Paraguay, and Argentina. Powered predominantly by environmentally friendly hydro-electric and long-term power contracts, Bitfarms is committed to using sustainable and often underutilized energy infrastructure.
To learn more about Bitfarms’ events, developments, and online communities:
www.bitfarms.com
https://www.facebook.com/bitfarms/
http://x.com/Bitfarms_io
https://www.instagram.com/bitfarms/
https://www.linkedin.com/company/bitfarms/
Glossary of Terms
- BTC BTC/day = Bitcoin or Bitcoin per day
- EHuM = Exahash Under Management, which includes Bitfarms’ proprietary hashrate and hashrate being hosted by Bitfarms for third-party hosting clients
- EH or EH/s = Exahash or exahash per second
- MW or MWh = Megawatts or megawatt hour
- w/TH = Watts/Terahash efficiency (includes cost of powering supplementary equipment)
- Q/Q = Quarter over Quarter
- Y/Y = Year over Year
- Synthetic HODL™ = the use of instruments that create Bitcoin equivalent exposure
- HPC/AI = High Performance Computing / Artificial Intelligence
Forward-Looking Statements
This news release contains certain “forward-looking information” and “forward-looking statements” (collectively, “forward-looking information”) that are based on expectations, estimates and projections as at the date of this news release and are covered by safe harbors under Canadian and United States securities laws. The statements and information in this release regarding the the Company’s energy pipeline and its anticipated megawatt growth in each of the years 2025, 2026 and 2028, its revenue diversification strategy, the success of the Company’s HPC/AI strategy and its ability to capitalize on growing demand for AI computing while securing predictable cash flows, the Company’s ability to drive greater shareholder value, and other statements regarding future growth, plans and objectives of the Company are forward-looking information.
Any statements that involve discussions with respect to predictions, expectations, beliefs, plans, projections, objectives, assumptions, future events or performance (often but not always using phrases such as “expects”, or “does not expect”, “is expected”, “anticipates” or “does not anticipate”, “plans”, “budget”, “scheduled”, “forecasts”, “estimates”, “prospects”, “believes” or “intends” or variations of such words and phrases or stating that certain actions, events or results “may” or “could”, “would”, “might” or “will” be taken to occur or be achieved) are not statements of historical fact and may be forward-looking information.
This forward-looking information is based on assumptions and estimates of management of Bitfarms at the time they were made, and involves known and unknown risks, uncertainties and other factors which may cause the actual results, performance, or achievements of Bitfarms to be materially different from any future results, performance or achievements expressed or implied by such forward-looking information. Such factors, risks and uncertainties include, among others: the construction and operation of new facilities may not occur as currently planned, or at all; expansion of existing facilities may not materialize as currently anticipated, or at all; new miners may not perform up to expectations; revenue may not increase as currently anticipated, or at all; the ongoing ability to successfully mine digital currency is not assured; failure of the equipment upgrades to be installed and operated as planned; the availability of additional power may not occur as currently planned, or at all; expansion may not materialize as currently anticipated, or at all; the power purchase agreements and economics thereof may not be as advantageous as expected; potential environmental cost and regulatory penalties due to the operation of the former Stronghold plants which entail environmental risk and certain additional risk factors particular to the former business and operations of Stronghold including, land reclamation requirements may be burdensome and expensive, changes in tax credits related to coal refuse power generation could have a material adverse effect on the business, financial condition, results of operations and future development efforts, competition in power markets may have a material adverse effect on the results of operations, cash flows and the market value of the assets, the business is subject to substantial energy regulation and may be adversely affected by legislative or regulatory changes, as well as liability under, or any future inability to comply with, existing or future energy regulations or requirements, the operations are subject to a number of risks arising out of the threat of climate change, and environmental laws, energy transitions policies and initiatives and regulations relating to emissions and coal residue management, which could result in increased operating and capital costs and reduce the extent of business activities, operation of power generation facilities involves significant risks and hazards customary to the power industry that could have a material adverse effect on our revenues and results of operations, and there may not have adequate insurance to cover these risks and hazards, employees, contractors, customers and the general public may be exposed to a risk of injury due to the nature of the operations, limited experience with carbon capture programs and initiatives and dependence on third-parties, including consultants, contractors and suppliers to develop and advance carbon capture programs and initiatives, and failure to properly manage these relationships, or the failure of these consultants, contractors and suppliers to perform as expected, could have a material adverse effect on the business, prospects or operations; the digital currency market; the ability to successfully mine digital currency; it may not be possible to profitably liquidate the current digital currency inventory, or at all; a decline in digital currency prices may have a significant negative impact on operations; an increase in network difficulty may have a significant negative impact on operations; the volatility of digital currency prices; the anticipated growth and sustainability of hydroelectricity for the purposes of cryptocurrency mining in the applicable jurisdictions; the inability to maintain reliable and economical sources of power to operate cryptocurrency mining assets; the risks of an increase in electricity costs, cost of natural gas, changes in currency exchange rates, energy curtailment or regulatory changes in the energy regimes in the jurisdictions in which Bitfarms operates and the potential adverse impact on profitability; future capital needs and the ability to complete current and future financings, including Bitfarms’ ability to utilize an at-the-market offering program ( “ATM Program”) and the prices at which securities may be sold in such ATM Program, as well as capital market conditions in general; share dilution resulting from an ATM Program and from other equity issuances; volatile securities markets impacting security pricing unrelated to operating performance; the risk that a material weakness in internal control over financial reporting could result in a misstatement of financial position that may lead to a material misstatement of the annual or interim consolidated financial statements if not prevented or detected on a timely basis; risks related to the Company ceasing to qualify as an “emerging growth company”; risks related to unsolicited investor interest, takeover proposals, shareholder activism or proxy contests relating to the election of directors; historical prices of digital currencies and the ability to mine digital currencies that will be consistent with historical prices; and the adoption or expansion of any regulation or law that will prevent Bitfarms from operating its business, or make it more costly to do so. For further information concerning these and other risks and uncertainties, refer to Bitfarms’ filings on www.sedarplus.ca (which are also available on the website of the U.S. Securities and Exchange Commission (the “SEC") at www.sec.gov), including the management’s discussion & analysis for the year-ended December 31, 2024 Although Bitfarms has attempted to identify important factors that could cause actual results to differ materially from those expressed in forward-looking statements, there may be other factors that cause results not to be as anticipated, estimated or intended, including factors that are currently unknown to or deemed immaterial by Bitfarms. There can be no assurance that such statements will prove to be accurate as actual results, and future events could differ materially from those anticipated in such statements. Accordingly, readers should not place undue reliance on any forward-looking information. Bitfarms does not undertake any obligation to revise or update any forward-looking information other than as required by law. Trading in the securities of the Company should be considered highly speculative. No stock exchange, securities commission or other regulatory authority has approved or disapproved the information contained herein. Neither the Toronto Stock Exchange, Nasdaq, or any other securities exchange or regulatory authority accepts responsibility for the adequacy or accuracy of this release.
Investor Relations Contacts:
Bitfarms
Tracy Krumme
SVP, Head of IR & Corp. Comms.
+1 786-671-5638
tkrumme@bitfarms.com
Media Contacts:
Caroline Brady Baker
Director, Communications
cbaker@bitfarms.com
| Bitfarms Ltd. Consolidated Financial & Operational Results | ||||||||||||||||
| Three months ended December 31, | Year ended December 31, | |||||||||||||||
| (U.S.$ in thousands except where indicated) | 2024 | 2023 | $ Change | % Change | 2024 | 2023 | $ Change | % Change | ||||||||
| Revenues | 56,163 | 46,241 | 9,922 | 21 | % | 192,881 | 146,366 | 46,515 | 32 | % | ||||||
| Cost of revenues | (54,776 | ) | (44,484 | ) | (10,292 | ) | 23 | % | (225,240 | ) | (167,868 | ) | (57,372 | ) | 34 | % |
| Gross (loss) profit | 1,387 | 1,757 | (370 | ) | (21) | % | (32,359 | ) | (21,502 | ) | (10,857 | ) | 50 | % | ||
| Gross margin (1) | 2 | % | 4 | % | — | — | (17) | % | (15) | % | — | — | ||||
| Operating expenses | ||||||||||||||||
| General and administrative expenses | (18,042 | ) | (13,405 | ) | (4,637 | ) | 35 | % | (71,240 | ) | (39,292 | ) | (31,948 | ) | 81 | % |
| Reversal of revaluation loss on digital assets | — | 1,183 | (1,183 | ) | (100) | % | — | 2,695 | (2,695 | ) | (100) | % | ||||
| Gain (loss) on disposition of property, plant and equipment and deposits | 270 | (2 | ) | 272 | nm | (336 | ) | (1,778 | ) | 1,442 | (81) | % | ||||
| Impairment on short-term prepaid deposits, property, plant and equipment and assets held for sale | — | (2,270 | ) | 2,270 | 100 | % | (3,628 | ) | (12,252 | ) | 8,624 | (70) | % | |||
| Operating loss | (16,385 | ) | (12,737 | ) | (3,648 | ) | 29 | % | (107,563 | ) | (72,129 | ) | (35,434 | ) | 49 | % |
| Operating margin (1) | (29) | % | (28) | % | — | — | (56) | % | (49) | % | — | — | ||||
| Net financial income (expenses) | 21,843 | (49,686 | ) | 71,529 | 144 | % | 39,210 | (37,194 | ) | 76,404 | 205 | % | ||||
| Net (loss) income before income taxes | 5,458 | (62,423 | ) | 67,881 | 109 | % | (68,353 | ) | (109,323 | ) | 40,970 | (37) | % | |||
| Income tax recovery | 9,707 | 378 | 9,329 | nm | 14,290 | 401 | 13,889 | nm | ||||||||
| Net (loss) income | 15,165 | (62,045 | ) | 77,210 | 124 | % | (54,063 | ) | (108,922 | ) | 54,859 | (50) | % | |||
| Basic (loss) earnings per share (in U.S. dollars) | 0.03 | (0.21 | ) | — | — | (0.13 | ) | (0.42 | ) | — | — | |||||
| Diluted earnings (loss) per share (in U.S. dollars) | 0.03 | (0.21 | ) | — | — | (0.13 | ) | (0.42 | ) | — | — | |||||
| Change in revaluation surplus - digital assets, net of tax | 26,421 | 7,675 | 18,746 | 244 | % | 39,120 | 9,242 | 29,878 | 323 | % | ||||||
| Total comprehensive income (loss), net of tax | 41,586 | (54,370 | ) | 95,956 | 176 | % | (14,943 | ) | (99,680 | ) | 84,737 | (85 | %) | |||
| Gross Mining profit (2) | 25,786 | 25,454 | 332 | 1 | % | 94,469 | 70,277 | 24,192 | 34 | % | ||||||
| Gross Mining margin (2) | 47 | % | 57 | % | — | — | 50 | % | 50 | % | — | — | ||||
| EBITDA (2) | 29,752 | (40,542 | ) | 70,294 | 173 | % | 68,315 | (21,879 | ) | 90,194 | 412 | % | ||||
| EBITDA margin (2) | 53 | % | (88) | % | — | — | 35 | % | (15) | % | — | — | ||||
| Adjusted EBITDA (2) | 14,315 | 16,332 | (2,017 | ) | (12) | % | 54,661 | 43,558 | 11,103 | 25 | % | |||||
| Adjusted EBITDA margin (2) | 25 | % | 35 | % | — | — | 28 | % | 30 | % | — | — | ||||
| 1 | Gross margin and Operating margin are supplemental financial ratios; refer to Section 10 - Non-IFRS and Other Financial Measures and Ratios of the Company's MD&A. |
| 2 | Gross Mining profit, Gross Mining margin, EBITDA, EBITDA margin, Adjusted EBITDA and Adjusted EBITDA margin are non-IFRS measures or ratios; refer to Section 10 - Non-IFRS and Other Financial Measures and Ratios of the Company's MD&A. |
| Bitfarms Ltd. Reconciliation of Consolidated Net Income (loss) to EBITDA and Adjusted EBITDA | ||||||||||||||||
| Three months ended December 31, | Year ended December 31, | |||||||||||||||
| (U.S.$ in thousands except where indicated) | 2024 | 2023 | $ Change | % Change | 2024 | 2023 | $ Change | % Change | ||||||||
| Revenues | 56,163 | 46,241 | 9,922 | 21 | % | 192,881 | 146,366 | 46,515 | 32 | % | ||||||
| Net (loss) income before income taxes | 5,458 | (62,423 | ) | 67,881 | nm | (68,353 | ) | (109,323 | ) | 40,970 | (37) | % | ||||
| Interest (income) and expense | (290 | ) | 91 | (381 | ) | (419) | % | (4,299 | ) | 2,659 | (6,958 | ) | (262) | % | ||
| Depreciation and amortization | 24,584 | 21,790 | 2,794 | 13 | % | 149,727 | 84,785 | 64,942 | 77 | % | ||||||
| Sales tax recovery - depreciation and amortization | — | — | — | — | % | (8,760 | ) | — | (8,760 | ) | 100 | % | ||||
| EBITDA | 29,752 | (40,542 | ) | 70,294 | nm | 68,315 | (21,879 | ) | 90,194 | nm | ||||||
| EBITDA margin | 53 | % | (88) | % | — | — | 35 | % | (15) | % | — | nm | ||||
| Share-based payment | 4,021 | 3,906 | 115 | 3 | % | 13,949 | 10,915 | 3,034 | 28 | % | ||||||
| Impairment on short-term prepaid deposits, property, plant and equipment and assets held for sale | — | 2,270 | (2,270 | ) | 100 | % | 3,628 | 12,252 | (8,624 | ) | (70) | % | ||||
| Reversal of revaluation loss on digital assets | — | (1,183 | ) | 1,183 | 100 | % | — | (2,695 | ) | 2,695 | 100 | % | ||||
| Gain on extinguishment of long-term debt and lease liabilities | — | — | — | — | % | — | (12,835 | ) | 12,835 | 100 | % | |||||
| (Gain) loss revaluation of warrants | (6,314 | ) | 42,760 | (49,074 | ) | (115) | % | (19,603 | ) | 42,974 | (62,577 | ) | (146) | % | ||
| Gain on disposition of marketable securities | (782 | ) | (999 | ) | 217 | (22) | % | (2,313 | ) | (12,245 | ) | 9,932 | (81) | % | ||
| Service fees not associated with ongoing operations | 1,287 | — | 1,287 | 100 | % | 13,766 | — | 13,766 | 100 | % | ||||||
| Sales tax recovery - prior years - energy and infrastructure and G&A expenses (1) | — | 2,485 | (2,485 | ) | 100 | % | (16,081 | ) | 9,281 | (25,362 | ) | (273) | % | |||
| Net financial (income) expense and other | (13,649 | ) | 7,635 | (21,284 | ) | (279) | % | (7,000 | ) | 17,790 | (24,790 | ) | (139) | % | ||
| Adjusted EBITDA | 14,315 | 16,332 | (2,017 | ) | (12) | % | 54,661 | 43,558 | 11,103 | 25 | % | |||||
| Adjusted EBITDA margin | 25 | % | 35 | % | — | — | 28 | % | 30 | % | — | — | ||||
nm: not meaningful
| 1 | Sales tax recovery relating to energy and infrastructure and general and administrative expenses have been allocated to their respective periods; refer to Note 29b - Additional Details to the Statement of Profit or Loss and Comprehensive Profit or Loss (Canadian sales tax refund) to the Financial Statements. |
| Bitfarms Ltd. Calculation of Gross Mining Profit and Gross Mining Margin | ||||||||||||||||
| Three months ended December 31, | Year ended December 31, | |||||||||||||||
| (U.S.$ in thousands except where indicated) | 2024 | 2023 | $ Change | % Change | 2024 | 2023 | $ Change | % Change | ||||||||
| Gross (loss) profit | 1,387 | 1,757 | (370 | ) | (21) % | (32,359 | ) | (21,502 | ) | (10,857 | ) | 50 | % | |||
| Non-Mining revenues¹ | (1,592 | ) | (1,285 | ) | (307 | ) | 24 | % | (5,102 | ) | (5,060 | ) | (42 | ) | 1 | % |
| Depreciation and amortization | 24,584 | 21,790 | 2,794 | 13 | % | 149,727 | 84,785 | 64,942 | 77 | % | ||||||
| Sales tax recovery - depreciation and amortization | — | — | — | — | % | (8,760 | ) | — | (8,760 | ) | (100) | |||||
| Electrical components and salaries | 1,403 | 1,095 | 308 | 28 | % | 4,081 | 4,151 | (70 | ) | (2) | % | |||||
| Sales tax recovery - prior years - energy and infrastructure² | — | 2,211 | (2,211 | ) | 100 | % | (14,338 | ) | 8,366 | (22,704 | ) | (271) | % | |||
| Other | 4 | (114 | ) | 118 | nm | 1,220 | (463 | ) | 1,683 | nm | ||||||
| Gross Mining profit | 25,786 | 25,454 | 332 | 1 | % | 94,469 | 70,277 | 24,192 | 34 | % | ||||||
| Gross Mining margin | 47 | % | 57 | % | — | — | 50 | % | 50 | % | — | — | ||||
nm: not meaningful
| (1 | ) | Non-Mining revenues reconciliation: |
| Three months ended December 31, | Year ended December 31, | |||||||||||||||
| (U.S.$ in thousands except where indicated) | 2024 | 2023 | $ Change | % Change | 2024 | 2023 | $ Change | % Change | ||||||||
| Revenues | 56,163 | 46,241 | 9,922 | 21 | % | 192,881 | 146,366 | 46,515 | 32 | % | ||||||
| Less Mining related revenues for the purpose of calculating gross Mining margin: | ||||||||||||||||
| Mining revenues³ | (54,571 | ) | (44,956 | ) | (9,615 | ) | 21 | % | (187,779 | ) | (141,306 | ) | (46,473 | ) | 33 | % |
| Non-Mining revenues | 1,592 | 1,285 | 307 | 24 | % | 5,102 | 5,060 | 42 | 1 | % | ||||||
| (2 | ) | Sales tax recovery relating to energy and infrastructure expenses has been allocated to their respective periods; refer to Note 29b - Additional Details to the Statement of Profit or Loss and Comprehensive Profit or Loss (Canadian sales tax refund) to the Financial Statements. |
| (3 | ) | Mining revenues include revenues from sale of computational power used for hashing calculations and revenues from computational power sold in exchange of services. |
| Bitfarms Ltd. Calculation of Direct Cost and Direct Cost per BTC | ||||||||||||||||
| Three months ended December 31, | Year ended December 31, | |||||||||||||||
| (U.S.$ in thousands except where indicated) | 2024 | 2023 | $ Change | % Change | 2024 | 2023 | $ Change | % Change | ||||||||
| Cost of revenues | 54,776 | 44,484 | 10,292 | 23 | % | 225,240 | 167,868 | 57,372 | 34 | % | ||||||
| Depreciation and amortization | (24,584 | ) | (21,790 | ) | (2,794 | ) | 13 | % | (149,727 | ) | (84,785 | ) | (64,942 | ) | 77 | % |
| Sales tax recovery - depreciation and amortization | — | — | — | — | % | 8,760 | — | 8,760 | 100 | % | ||||||
| Electrical components and salaries | (1,403 | ) | (1,091 | ) | (312 | ) | 29 | % | (4,081 | ) | (4,141 | ) | 60 | (1) | % | |
| Infrastructure | (1,456 | ) | (1,607 | ) | 151 | (9) | % | (5,784 | ) | (3,909 | ) | (1,875 | ) | 48 | % | |
| Sales tax recovery - prior years - energy and infrastructure (1) | — | (2,211 | ) | 2,211 | 100 | % | 14,338 | (8,366 | ) | 22,704 | 271 | % | ||||
| Other | (649 | ) | — | (649 | ) | (100) | % | — | 82 | (82 | ) | (100) | % | |||
| Direct Cost | 26,684 | 17,785 | 8,899 | 50 | % | 88,746 | 66,749 | 21,997 | 33 | % | ||||||
| Quantity of BTC earned | 654 | 1,236 | (582 | ) | (47) | % | 2,914 | 4,928 | (2,014 | ) | (41) | % | ||||
| Direct Cost per BTC (in U.S. dollars) | 40,800 | 14,400 | 26,400 | 183 | % | 30,500 | 13,500 | 17,000 | 126 | % | ||||||
nm: not meaningful
| Bitfarms Ltd. Calculation of Total Cash Cost and Total Cost per BTC | ||||||||||||||||
| Three months ended December 31, | Year ended December 31, | |||||||||||||||
| (U.S.$ in thousands except where indicated) | 2024 | 2023 | $ Change | % Change | 2024 | 2023 | $ Change | % Change | ||||||||
| Cost of revenues | 54,776 | 44,484 | 10,292 | 23 | % | 225,240 | 167,868 | 57,372 | 34 | % | ||||||
| General and administrative expenses | 18,042 | 13,405 | 4,637 | 35 | % | 71,240 | 39,292 | 31,948 | 81 | % | ||||||
| 72,818 | 57,889 | 14,929 | 26 | % | 296,480 | 207,160 | 89,320 | 43 | % | |||||||
| Depreciation and amortization | (24,584 | ) | (21,790 | ) | (2,794 | ) | 13 | % | (149,727 | ) | (84,785 | ) | (64,942 | ) | 77 | % |
| Non-cash service expense (2) | (688 | ) | — | (688 | ) | (100) | % | (1,252 | ) | — | (1,252 | ) | (100) | % | ||
| Sales tax recovery - depreciation and amortization | — | — | — | — | % | 8,760 | — | 8,760 | 100 | % | ||||||
| Electrical components and salaries | (1,403 | ) | (1,091 | ) | (312 | ) | 29 | % | (4,081 | ) | (4,141 | ) | 60 | (1) | % | |
| Share-based payment | (4,021 | ) | (3,906 | ) | (115 | ) | 3 | % | (13,949 | ) | (10,915 | ) | (3,034 | ) | 28 | % |
| Service fees not associated with ongoing operations | (1,287 | ) | — | (1,287 | ) | (100) | % | (13,766 | ) | — | (13,766 | ) | (100) | % | ||
| Sales tax recovery - prior years - energy and infrastructure and G&A expenses (1) | — | (2,485 | ) | 2,485 | 100 | % | 16,081 | (9,281 | ) | 25,362 | 273 | % | ||||
| Other | (1,078 | ) | 201 | (1,279 | ) | (636) | % | (5,659 | ) | 890 | (6,549 | ) | (736) | % | ||
| Total Cash Cost | 39,757 | 28,818 | 10,939 | 38 | % | 132,887 | 98,928 | 33,959 | 34 | % | ||||||
| Quantity of BTC earned | 654 | 1,236 | (582 | ) | (47) | % | 2,914 | 4,928 | (2,014 | ) | (41) | % | ||||
| Total Cash Cost per BTC (in U.S. dollars) | 60,800 | 23,300 | 37,500 | 161 | % | 45,600 | 20,100 | 25,500 | 127 | % | ||||||
nm: not meaningful
| 1 | Sales tax recovery relating to energy and infrastructure and general and administrative expenses have been allocated to their respective periods; refer to Note 29b - Additional Details to the Statement of Profit or Loss and Comprehensive Profit or Loss (Canadian sales tax refund) to the Financial Statements. |
| 2 | Non-cash service expense, included in infrastructure, which was exchanged for computational power sold. |
A photo accompanying this announcement is available at https://www.globenewswire.com/NewsRoom/AttachmentNg/d24a5e36-6201-4d4f-a4f9-8fdc9aaeb95b

![]()