

Commercial lighting and retail display solutions provider LSI (NASDAQ: LYTS) reported Q3 CY2024 results exceeding the market’s revenue expectations, with sales up 11.9% year on year to $138.1 million. Its GAAP profit of $0.22 per share was also 10% above analysts’ consensus estimates.
Is now the time to buy LSI? Find out by accessing our full research report, it’s free.
LSI (LYTS) Q3 CY2024 Highlights:
- Revenue: $138.1 million vs analyst estimates of $130.9 million (5.5% beat)
- EPS: $0.22 vs analyst estimates of $0.20 (10% beat)
- EBITDA: $13.43 million vs analyst estimates of $13.3 million (small beat)
- Gross Margin (GAAP): 24.4%, down from 29.9% in the same quarter last year
- Operating Margin: 6.6%, down from 9.2% in the same quarter last year
- EBITDA Margin: 9.7%, down from 11.7% in the same quarter last year
- Free Cash Flow Margin: 8%, similar to the same quarter last year
- Market Capitalization: $521.4 million
“During a period of fluctuating demand levels within our vertical markets, LSI continues to build leading positions across our key markets during the first quarter, though a combination of new business wins, together with the recent, successful integration of EMI Industries,” stated James A. Clark, President, and Chief Executive Officer of LSI.
Company Overview
Enhancing commercial environments, LSI (NASDAQ: LYTS) provides lighting and display solutions for businesses and retailers.
Electrical Systems
Like many equipment and component manufacturers, electrical systems companies are buoyed by secular trends such as connectivity and industrial automation. More specific pockets of strong demand include Internet of Things (IoT) connectivity and the 5G telecom upgrade cycle, which can benefit companies whose cables and conduits fit those needs. But like the broader industrials sector, these companies are also at the whim of economic cycles. Interest rates, for example, can greatly impact projects that drive demand for these products.
Sales Growth
A company’s long-term performance can indicate its business quality. Any business can put up a good quarter or two, but many enduring ones grow for years. Thankfully, LSI’s 7.8% annualized revenue growth over the last five years was decent. This is a useful starting point for our analysis.
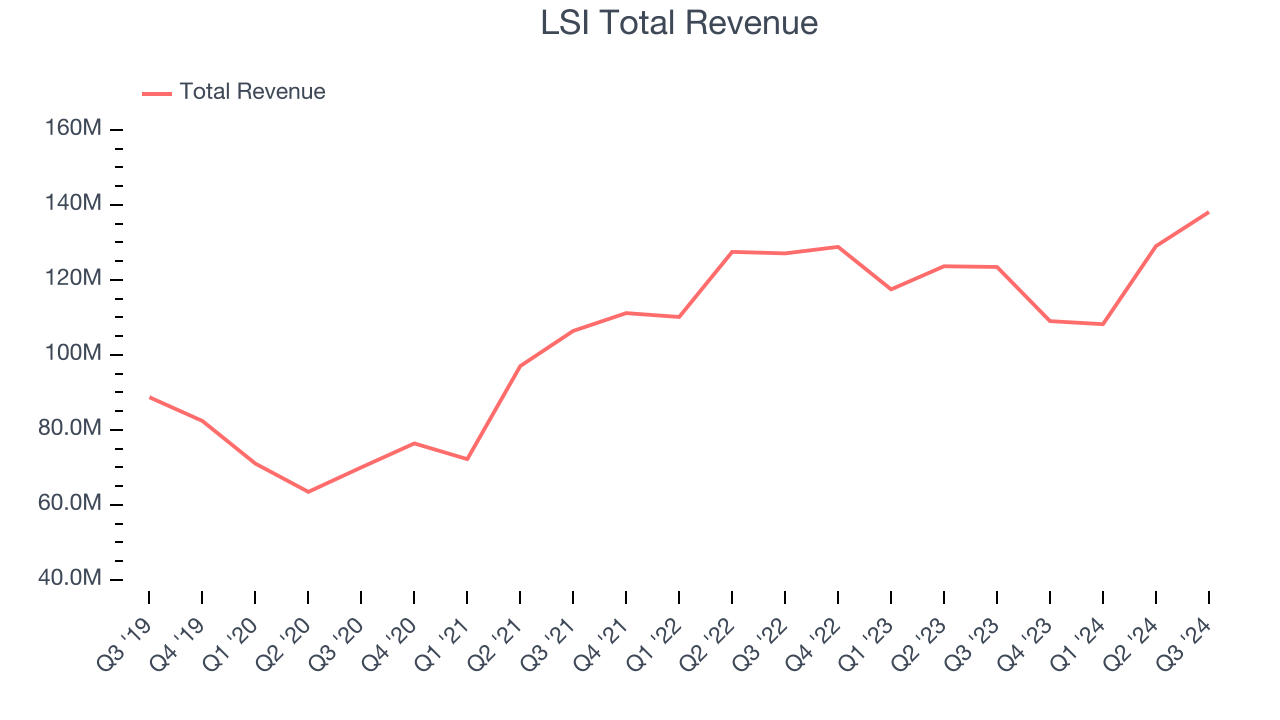
We at StockStory place the most emphasis on long-term growth, but within industrials, a half-decade historical view may miss cycles, industry trends, or a company capitalizing on catalysts such as a new contract win or a successful product line. LSI’s recent history shows its demand slowed as its revenue was flat over the last two years. 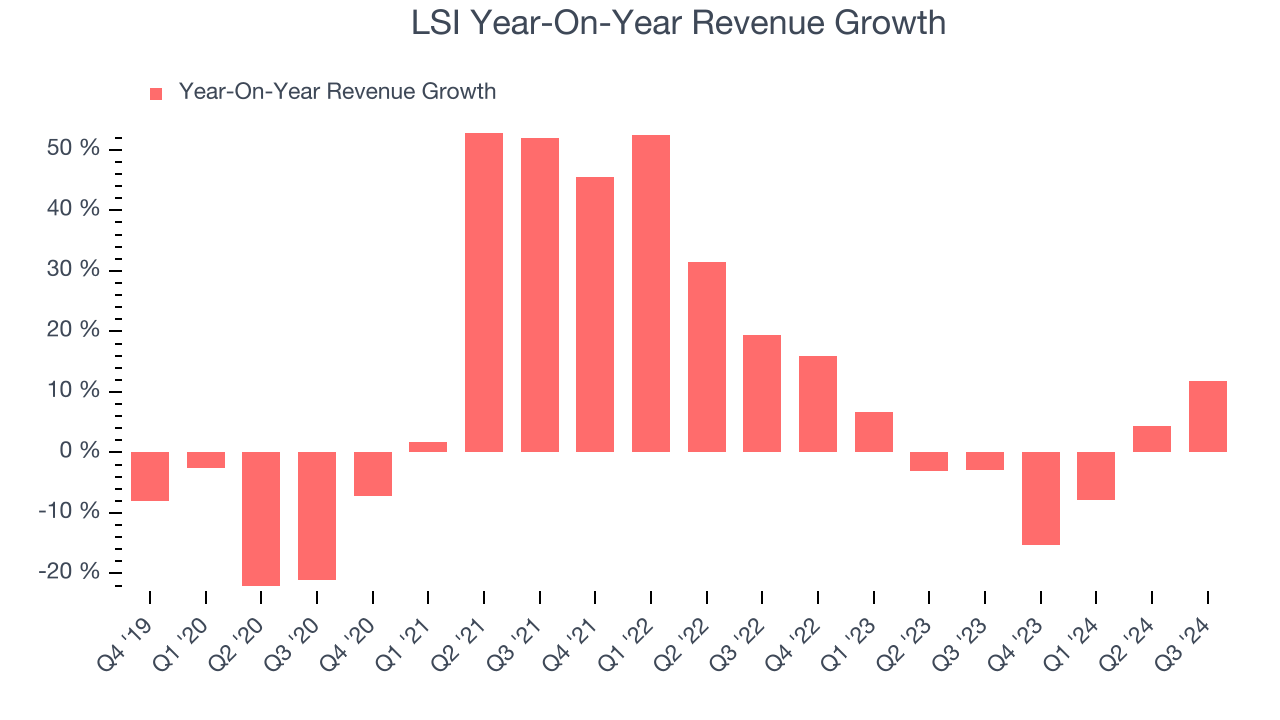
This quarter, LSI reported year-on-year revenue growth of 11.9%, and its $138.1 million of revenue exceeded Wall Street’s estimates by 5.5%.
Looking ahead, sell-side analysts expect revenue to grow 13.2% over the next 12 months, an improvement versus the last two years. This projection is admirable and indicates the market believes its newer products and services will catalyze higher growth rates.
Unless you’ve been living under a rock, it should be obvious by now that generative AI is going to have a huge impact on how large corporations do business. While Nvidia and AMD are trading close to all-time highs, we prefer a lesser-known (but still profitable) semiconductor stock benefitting from the rise of AI. Click here to access our free report on our favorite semiconductor growth story.
Operating Margin
Operating margin is one of the best measures of profitability because it tells us how much money a company takes home after procuring and manufacturing its products, marketing and selling them, and, most importantly, keeping them relevant through research and development.
LSI was profitable over the last five years but held back by its large cost base. Its average operating margin of 5.7% was weak for an industrials business. This result isn’t too surprising given its low gross margin as a starting point.
On the plus side, LSI’s annual operating margin rose by 5.2 percentage points over the last five years.
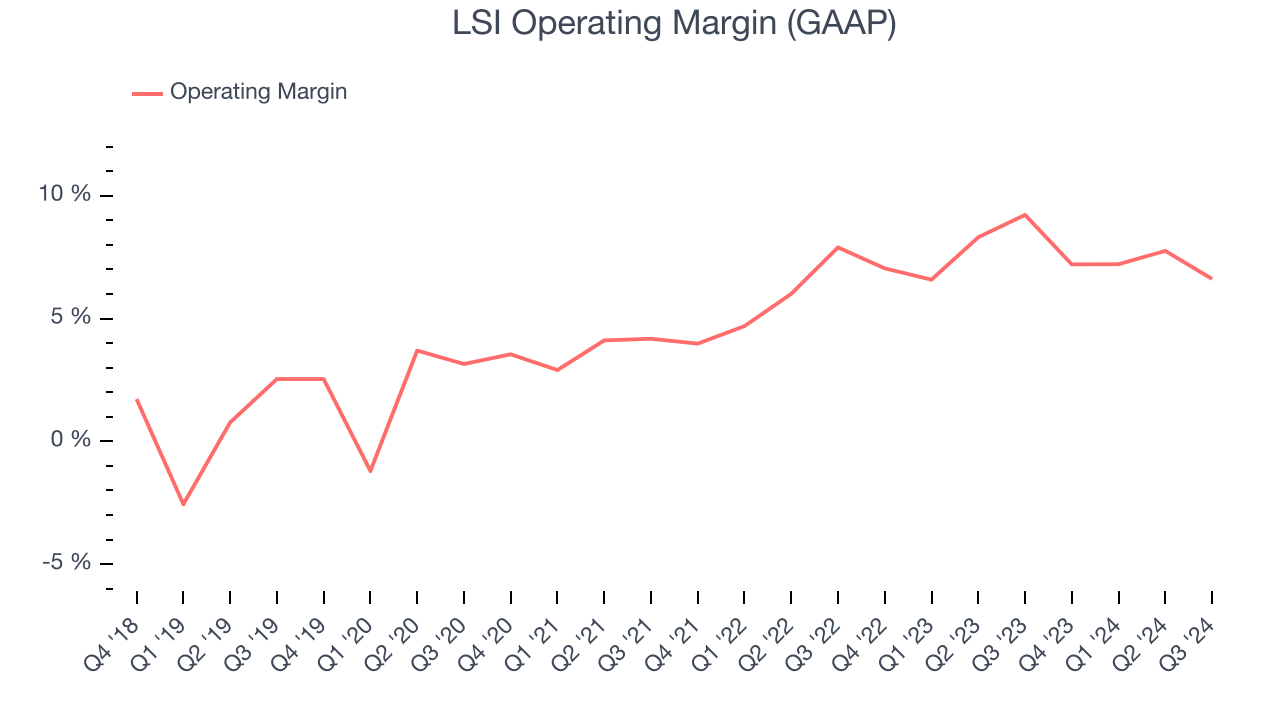
In Q3, LSI generated an operating profit margin of 6.6%, down 2.6 percentage points year on year. Since LSI’s gross margin decreased more than its operating margin, we can assume its recent inefficiencies were driven more by weaker leverage on its cost of sales rather than increased marketing, R&D, and administrative overhead expenses.
Earnings Per Share
Analyzing revenue trends tells us about a company’s historical growth, but the long-term change in its earnings per share (EPS) points to the profitability of that growth – for example, a company could inflate its sales through excessive spending on advertising and promotions.
LSI’s full-year EPS flipped from negative to positive over the last five years. This is encouraging and shows it’s at a critical moment in its life.
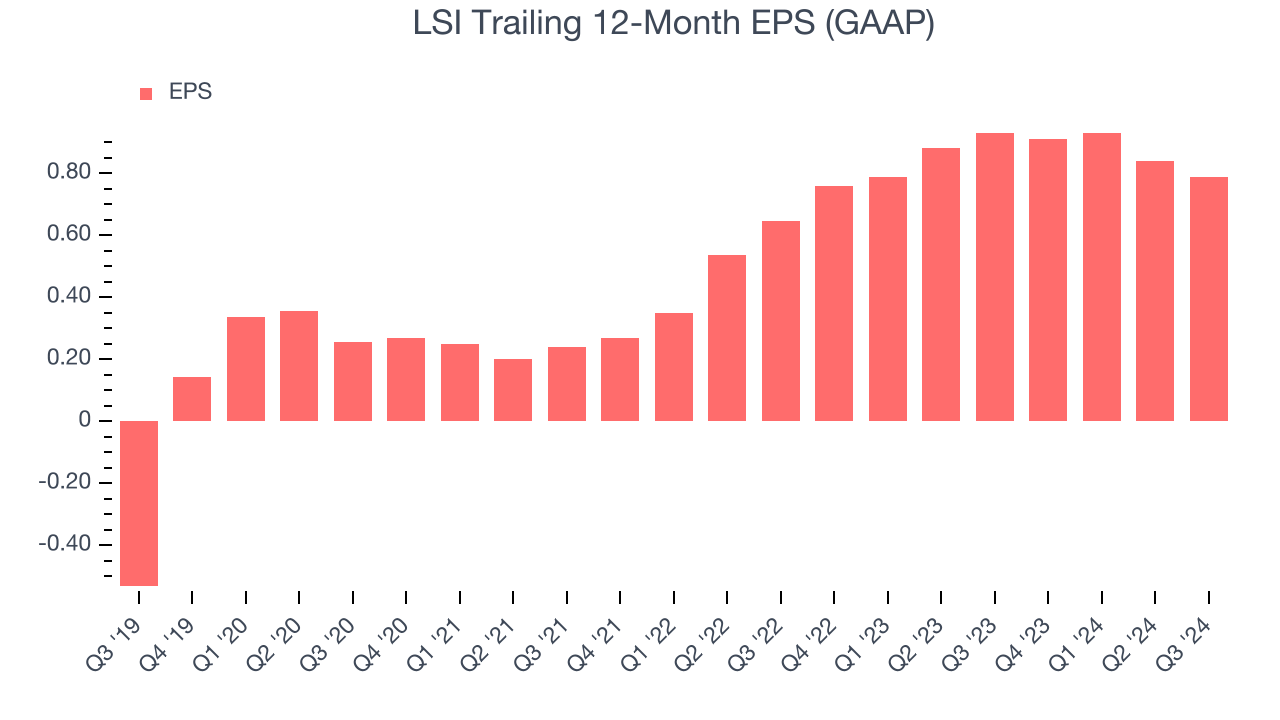
Like with revenue, we analyze EPS over a shorter period to see if we are missing a change in the business.
LSI’s EPS grew at a solid 10.4% compounded annual growth rate over the last two years, higher than its flat revenue. However, this alone doesn’t tell us much about its day-to-day operations because its operating margin didn’t expand during this timeframe.
In Q3, LSI reported EPS at $0.22, down from $0.27 in the same quarter last year. Despite falling year on year, this print beat analysts’ estimates by 10%. Over the next 12 months, Wall Street expects LSI’s full-year EPS of $0.79 to grow by 12%.
Key Takeaways from LSI’s Q3 Results
We were impressed by how significantly LSI blew past analysts’ revenue expectations this quarter. We were also glad its EPS outperformed Wall Street’s estimates. Zooming out, we think this quarter featured some important positives. The stock remained flat at $18.16 immediately after reporting.
Should you buy the stock or not? The latest quarter does matter, but not nearly as much as longer-term fundamentals and valuation, when deciding if the stock is a buy. We cover that in our actionable full research report which you can read here, it’s free.


