• Image 01
  • Image 02
  • Image 03
  • Image 04
  • Image 05
  • Image 06
Need assistance? Contact Us: 1-800-255-5897

Menu

  • Home
  • About Us
    • Company Overview
    • Management Team
    • Board of Directors
  • Your Loan Service Center
  • MAKE A PAYMENT
  • Business Service Center
  • Contact Us
  • Home
  • About Us
    • Company Overview
    • Management Team
    • Board of Directors
  • Your Loan Service Center
  • MAKE A PAYMENT
  • Business Service Center
  • Contact Us
Recent Quotes
View Full List
My Watchlist
Create Watchlist
Indicators
DJI
Nasdaq Composite
SPX
Gold
Crude Oil
Markets
Stocks
ETFs
Tools
Markets:
Overview
News
Currencies
International
Treasuries

Is EOG Resources Stock Underperforming the Dow?

By: Barchart.com
March 02, 2026 at 07:55 AM EST

With a market cap of $66.6 billion, EOG Resources, Inc. (EOG) is an energy company engaged in the exploration, development, production, and marketing of crude oil, natural gas liquids, and natural gas. Its operations span major producing basins across the United States, as well as the Republic of Trinidad and Tobago and other international locations. 

Companies valued at $10 billion or more are generally considered "large-cap" stocks and EOG Resources fits this criterion perfectly. In addition to upstream activities, the company provides crude oil and condensate services, along with gathering, processing, and marketing operations.

More Top Stocks Daily: Go behind Wall Street’s hottest headlines with Barchart’s Active Investor newsletter.


Shares of the leading oil and gas producer have slipped 4.9% from its 52-week high of $130.52. EOG stock has increased 16.8% over the past three months, outpacing the broader Dow Jones Industrials Average's ($DOWI) 3.3% rise over the same time frame.

www.barchart.com

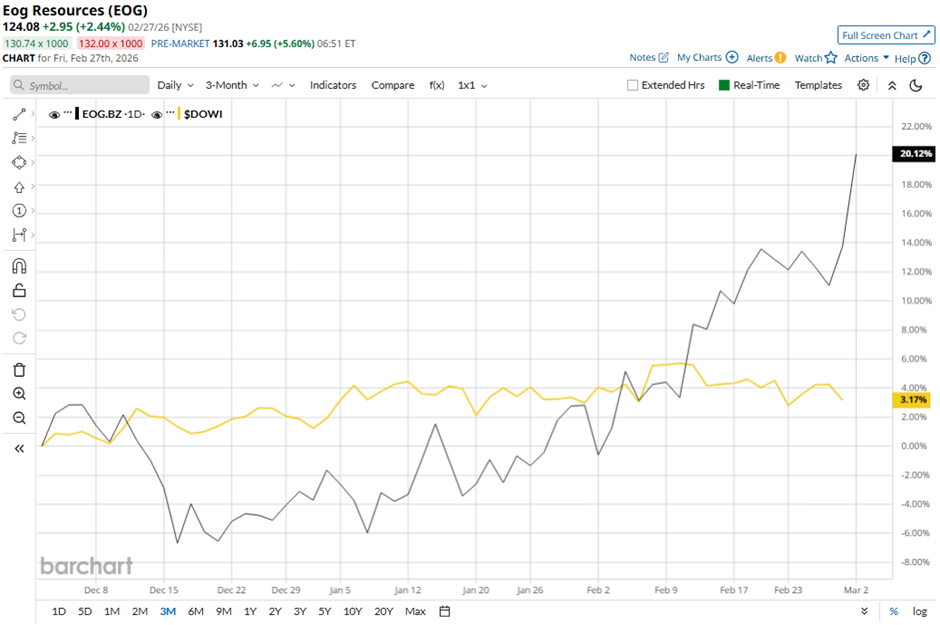
EOG stock is up 18.2% on a YTD basis, outperforming DOWI's 1.9% gain. Longer term, shares of EOG Resources have declined 5% over the past 52 weeks, lagging behind Dow Jones' 13.3% return over the same time frame. 

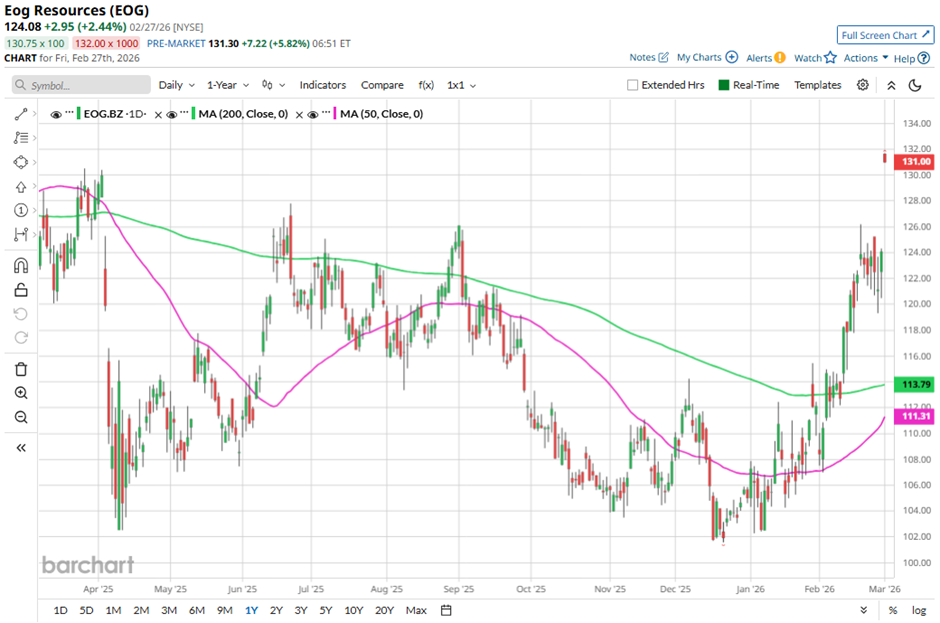
Yet, EOG stock has shown a bullish trend, trading above its 50-day moving average since late January and 200-day moving average since early February.

www.barchart.com

Shares of EOG Resources fell nearly 1% following its Q4 2025 results on Feb. 24. Net income dropped sharply to $701 million ($1.30 per share) from $1.47 billion ($2.70 per share) in Q3 2025, while total revenue declined to $5.64 billion from $5.85 billion, reflecting lower realized commodity prices, including WTI oil at $59.17/bbl versus $64.95/bbl in Q3. 

In comparison, rival Occidental Petroleum Corporation (OXY) has outpaced EOG stock. OXY stock has soared 29.1% on a YTD basis and 9.1% over the past year. 

Despite EOG's underperformance relative to the Dow over the past year, analysts are moderately optimistic about its prospects. The stock has a consensus “Moderate Buy” rating overall from the 33 analysts covering it and the mean price target of $134.66 is a premium of 8.5% to current levels. 


On the date of publication, Sohini Mondal did not have (either directly or indirectly) positions in any of the securities mentioned in this article. All information and data in this article is solely for informational purposes. For more information please view the Barchart Disclosure Policy here.


More news from Barchart

  • As Archer Aviation Enters a Patent War, Should You Buy, Sell, or Hold the Flying Car Stock?
  • Option Volatility And Earnings Report For March 2-6
  • Stock Index Futures Plunge Amid Middle East Conflict
  • Jobs, Geopolitics and Other Key Things to Watch this Week

More News

View More
News headline image
Uber and Joby Aviation Team Up: Game Changer or Hype? ↗
March 04, 2026
Via MarketBeat
Tickers JOBY UBER
News headline image
CrowdStrike Beats, But AI Concerns Persist ↗
March 04, 2026
Via MarketBeat
Topics Artificial Intelligence
Tickers CRWD
News headline image
GitLab Sell-Off Overdone: AI and Cash Flow Signal a Rebound ↗
March 04, 2026
Via MarketBeat
Topics Artificial Intelligence
Tickers GTLB
News headline image
Wall Street Loves FIGS—Why Do Price Targets Predict Pullback? ↗
March 04, 2026
Via MarketBeat
Tickers FIGS LULU
News headline image
3 Targeted Oil Plays as the Iran Crisis Lifts Crude ↗
March 04, 2026
Via MarketBeat
Tickers BKR HAL YPF

Recent Quotes

View More
Symbol Price Change (%)
AMZN  216.82
+8.09 (3.88%)
AAPL  262.52
-1.23 (-0.47%)
AMD  202.07
+11.12 (5.82%)
BAC  50.30
+0.33 (0.66%)
GOOG  303.45
-0.11 (-0.04%)
META  667.73
+12.65 (1.93%)
MSFT  405.20
+1.27 (0.31%)
NVDA  183.04
+2.99 (1.66%)
ORCL  152.37
+3.36 (2.25%)
TSLA  405.94
+13.51 (3.44%)
Stock Quote API & Stock News API supplied by www.cloudquote.io
Quotes delayed at least 20 minutes.
By accessing this page, you agree to the Privacy Policy and Terms Of Service.
© 2025 FinancialContent. All rights reserved.

Having difficulty making your payments? We're here to help! Call 1-800-255-5897

Copyright © 2019 Franklin Credit Management Corporation
All Rights Reserved
Contact Us | Privacy Policy | Terms of Use | Sitemap