
Almost one year ago, on June 17, 2025, I wrote a Barchart article asking if the VIX was too low. I concluded that article with the following:
VIXY can be a valuable short-term trading tool on price weakness in the VIX as the economic and geopolitical landscapes remain a hornet’s nest of potential problems. However, the most substantial upside potential will likely occur if market surprises emerge over the coming days and weeks. Moreover, as liquidity declines during the summer, the potential for sudden volatility increases. Be careful in markets during the coming weeks and months.
More Top Stocks Daily: Go behind Wall Street’s hottest headlines with Barchart’s Active Investor newsletter.
The VIX was at 19.42 on June 16, 2025. It was lower, below the 17 level, in late May 2026, despite many issues that could spark sudden, violent volatility.
The VIX is a market sentiment indicator
The CBOE Volatility Index (VIX) is one of the market’s most high-profile sentiment indicators. The S&P 500 is the most diversified U.S. stock market index, and the VIX reflects the implied volatility of S&P 500 stocks. The primary component of option prices is implied volatility, so the VIX is simply an index reflecting the market’s expectation of future price volatility, derived from put and call options on S&P 500 stocks.
Options are price insurance. The demand for insurance tends to increase when fear rises. In the stock market, fear grows when share prices drop. Therefore, the VIX tends to increase when stocks are falling and fall when they are rising. The VIX rises during bearish corrections as market participants buy options to protect risk positions., The VIX falls when market participants sell options to enhance income on stock holdings during stable or bullish market periods.
VIX readings above 30 tend to occur during fear periods, while readings below 20 reflect stable and bullish periods.
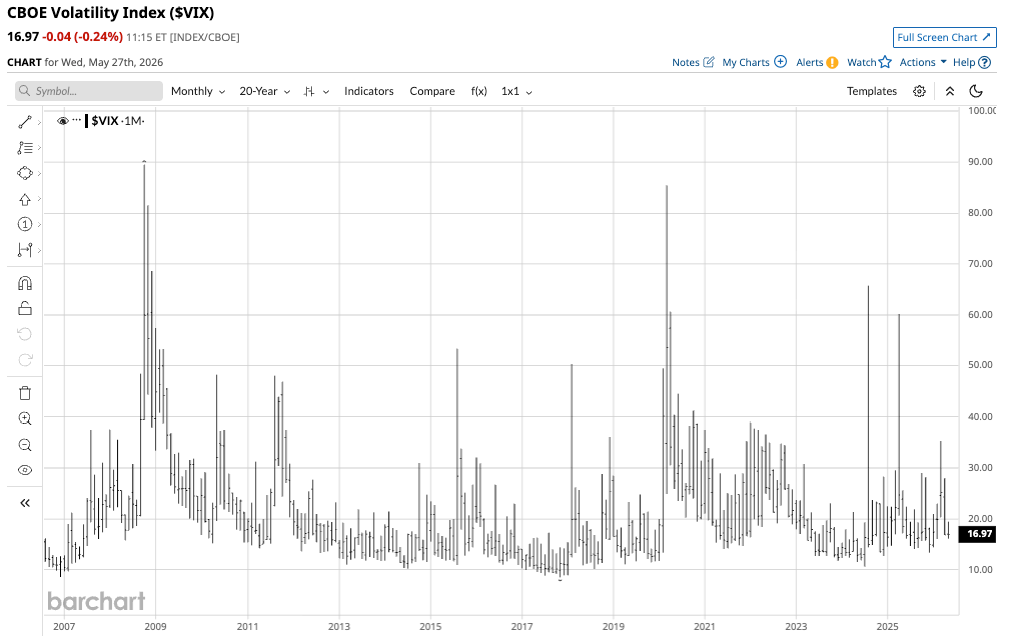
The monthly chart shows that the largest VIX increase occurred during the 2008 global financial crisis and the 2020 global pandemic. While there have been other instances of reading above 60, the events in 2008 and 2020 stand out. In 2026, the VIX traded between 14.43 and 35.30. The move above 30 occurred when the hostilities between the U.S. and Iran began in late February and early March. While the Middle East remains on the verge of further hostilities, the VIX has declined below 17, as the S&P 500 and other stock market indices have risen to new all-time highs in recent weeks.
U.S. debt is rising, and bonds are falling
U.S. government debt is rising toward the $40 trillion level. U.S. consumer debt is also at a record high, reaching $18.79 trillion in Q1 2026. Rising government and personal debt are putting upward pressure on long-term interest rates.
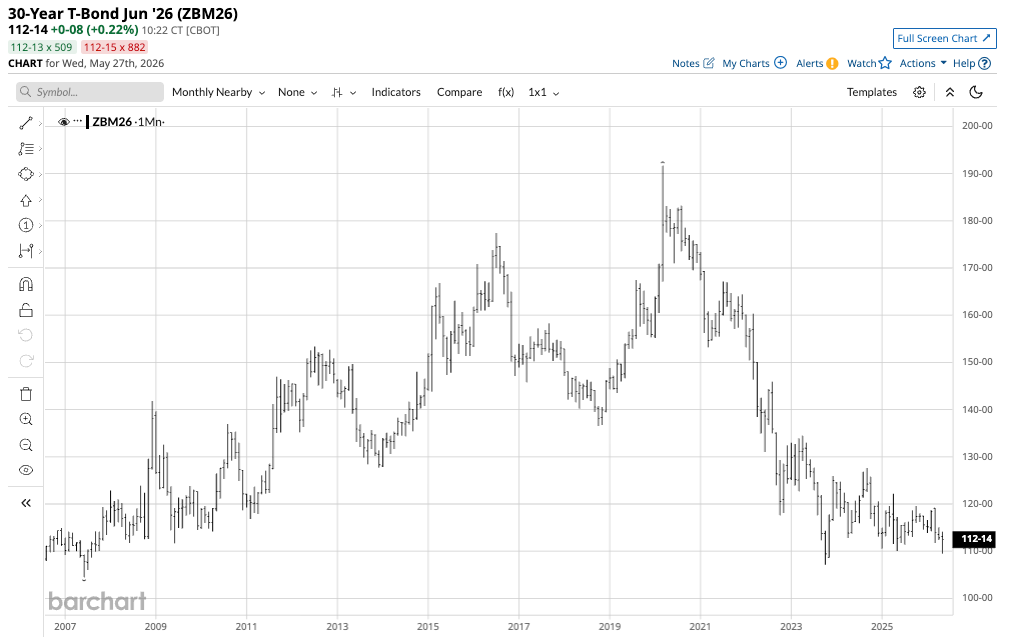
The monthly chart of the U.S. 30-year Treasury Bond Futures shows that the long bond fell from 191-22 on March 2020 as the global pandemic gripped markets, to a low of 107-04 in October 2023 as rising inflation pushed rates higher. Since early 2024, the bonds have traded in a 110-01 to 127-22 range. At the 112-14 level, the bonds are closer to the bottom end of the range.
Higher interest rates tend to weigh on the stock market, increasing the odds of another correction that would push the VIX higher.
The geopolitical landscape is a mess
The war in Ukraine continues to rage with no end in sight. The Russians and Ukrainians remain far apart on issues that would end the conflict. Meanwhile, a fragile ceasefire between the U.S. and Iran could fall apart in the blink of an eye. Iran has been sending mixed signals on issues that could end the conflict, and the U.S. administration could be losing patience. The Strait of Hormuz remains mostly closed to traffic, keeping crude oil prices around the $100 per barrel pivot point. A resumption of hostilities could send oil prices higher, increasing inflationary pressures. Rising inflation could send bond prices lower, with higher interest rates weighing on stocks and lifting the VIX as market participants buy price insurance.
Stocks are at record highs- U.S. midterm elections are on the horizon
In 2026, the Dow Jones Industrial Average, the S&P 500 index, the small-cap Russell 2000, and the tech-heavy NASDAQ Composite all reached all-time highs. The higher the stock prices rise, the greater the odds of a correction.
Meanwhile, U.S. voters will determine if Republicans keep slim majorities in the House of Representatives and Senate in the November midterm elections. Historically, the opposition party prevails in midterm elections, which could significantly impact the current administration’s policy initiatives. Uncertainty over the election could cause increasing volatility in the stock market, which would support a higher VIX reading.
The VIX is too low
All of these issues, along with the potential for unforeseen events that could shock markets, could lift the VIX index over the coming weeks and months. At just below 17, the VIX could be far too low in the current environment. The bottom line is that the risk-reward for the VIX favors the upside, as downside potential is limited.
The VIX is low due to record highs in the S&P 500 and other leading stock market indices. While it is possible that the VIX will return to the 2026 low of 14.43, it is only 2.57 above that level at 17. A move to the 2026 high of 35.30 would require an 18.3 increase in the volatility index. Therefore, the risk-reward ratio at 17 is better than 1:7 on long VIX positions.
On the date of publication, Andrew Hecht did not have (either directly or indirectly) positions in any of the securities mentioned in this article. All information and data in this article is solely for informational purposes. For more information please view the Barchart Disclosure Policy here.
More news from Barchart


