
• Image 01
  • Image 02
  • Image 03
  • Image 04
  • Image 05
  • Image 06
Need assistance? Contact Us: 1-800-255-5897

Menu

  • Home
  • About Us
    • Company Overview
    • Management Team
    • Board of Directors
  • Your Loan Service Center
  • MAKE A PAYMENT
  • Business Service Center
  • Contact Us
  • Home
  • About Us
    • Company Overview
    • Management Team
    • Board of Directors
  • Your Loan Service Center
  • MAKE A PAYMENT
  • Business Service Center
  • Contact Us
Recent Quotes
View Full List
My Watchlist
Create Watchlist
Indicators
DJI
Nasdaq Composite
SPX
Gold
Crude Oil
Markets
Stocks
ETFs
Tools
Markets:
Overview
News
Currencies
International
Treasuries

Is Visa Stock Underperforming the Nasdaq?

By: Barchart.com
May 28, 2026 at 22:28 PM EDT
ⓘ This article is third-party content and does not represent the views of this site. We make no guarantees regarding its accuracy or completeness.

With a market cap of $587.7 billion, Visa Inc. (V) is a global payments technology company that facilitates digital transactions across more than 200 countries and territories through its secure processing network, VisaNet. The company offers a broad portfolio of products and services, including credit, debit, prepaid solutions, digital payment innovations, risk management, and data analytics. 

Companies worth more than $200 billion are generally labeled as “mega-cap” stocks and Visa fits this criterion perfectly. Serving financial institutions, merchants, governments, and consumers, Visa also strengthens its brand through partnerships and sponsorships with organizations such as the Olympic Games, FIFA, and the NFL.

More Top Stocks Daily: Go behind Wall Street’s hottest headlines with Barchart’s Active Investor newsletter.


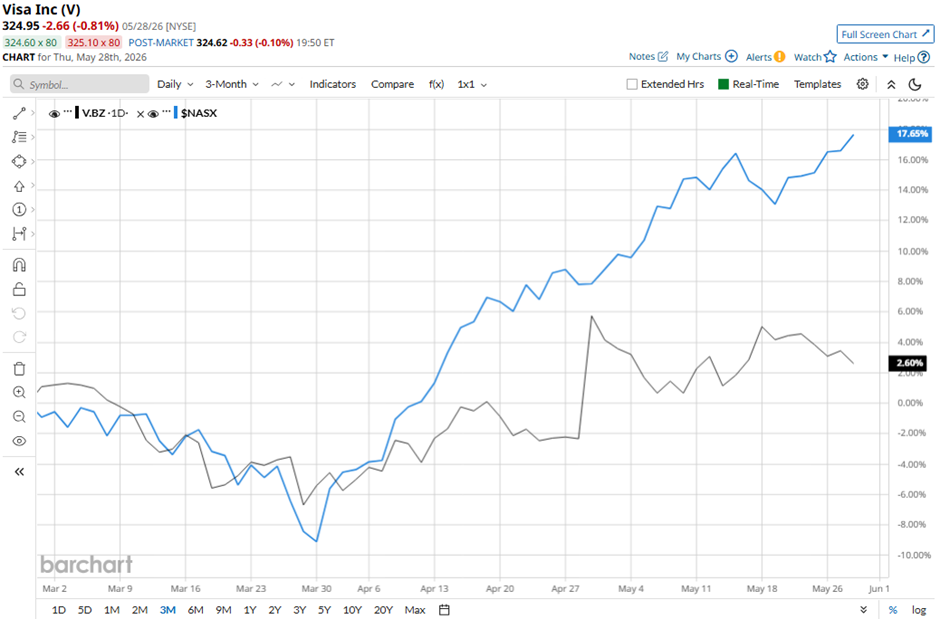
The San Francisco, California-based company stock has dipped 13.5% from its 52-week high of $375.51. Shares of Visa have risen 1.5% over the past three months, lagging behind the Nasdaq Composite’s ($NASX) 18.8% increase over the same time frame.
www.barchart.com

Visa stock is down 7.4% on a YTD basis, underperforming NASX’s 15.8% gain. In the longer term, shares of the global payments processor have decreased 9.7% over the past 52 weeks, compared to NASX’s 40.9% return over the same time frame.

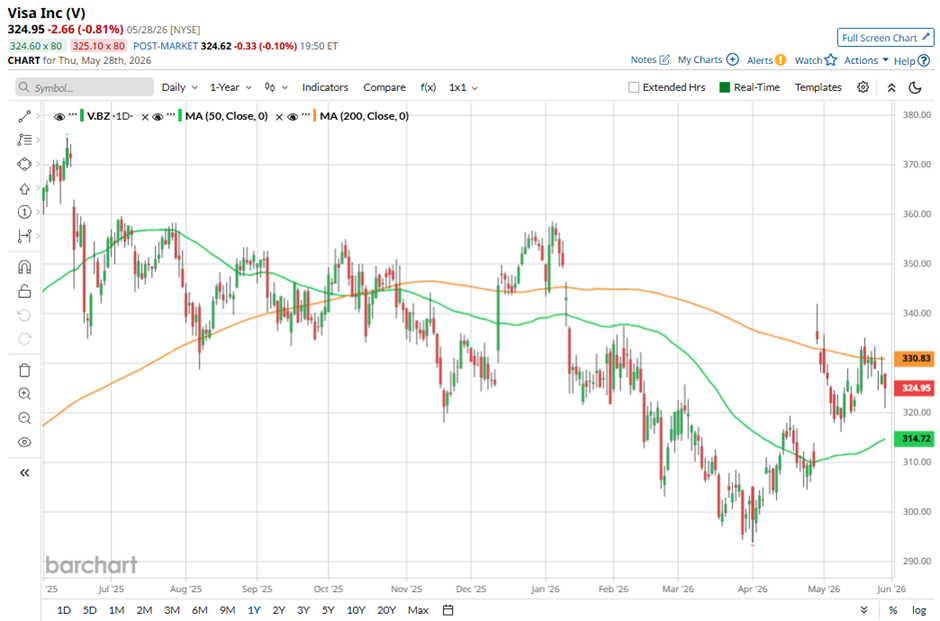
The stock has been trading below its 50-day and 200-day moving averages since early January. However, it has moved above its 50-day moving average since late April.
www.barchart.com

Shares of Visa climbed 8.3% following its Q2 2026 results on Apr. 28 after the company delivered stronger-than-expected adjusted EPS rising to $3.31 and net revenue increasing to $11.2 billion. Investors were encouraged by resilient consumer spending trends and strong transaction growth, as payments volume increased 9%, cross-border volume rose 12%, processed transactions advanced 9%, and key revenue streams including data processing revenue climbed 18% year-over-year to $5.54 billion. 

The rally was further fueled by Visa announcing a new $20 billion multiyear share repurchase program and raising its fiscal 2026 outlook to low-teens EPS growth and net revenue growth.

In comparison, rival Mastercard Incorporated (MA) has lagged behind Visa stock. Shares of Mastercard have declined 13.5 on a YTD basis and 14.3% over the past 52 weeks. 

While Visa stock has underperformed relative to the Nasdaq over the past year, analysts remain bullish about its prospects. The stock has a consensus rating of “Strong Buy” from 37 analysts' coverage, and the mean price target of $399.88 is a premium of 23.1% to current levels.


On the date of publication, Sohini Mondal did not have (either directly or indirectly) positions in any of the securities mentioned in this article. All information and data in this article is solely for informational purposes. For more information please view the Barchart Disclosure Policy here.


More news from Barchart

  • Ford Stock Is Moving Like Tesla Now. Its Results Can’t Justify the Premium.
  • Nano Nuclear Stock Looks Very Risky Despite Its Recent Acquisition
  • Cerebras Stock Will Ride the AI Wave With Innovation-Driven Growth
  • Robots, Drones, and Physical AI: How to Invest in LiDAR’s Second Act
Report this content

If you believe this article contains misleading, harmful, or spam content, please let us know.

Report this article

More News

View More
News headline image
A Market Panic Just Discounted the AI Highway's Tollbooth ↗
Today 14:00 EDT
Via MarketBeat
Topics Artificial Intelligence ETFs Earnings
Tickers ASML CAJPY INTC NINOY TSM
News headline image
Why Exxon Could Be the Market's Next Big Comeback Stock ↗
Today 13:25 EDT
Via MarketBeat
Tickers XOM
News headline image
The Market Just Got Shaken—These 3 ETFs May Come Out Stronger ↗
Today 12:35 EDT
Via MarketBeat
Topics Artificial Intelligence ETFs Stocks
Tickers AAPL AVGO FDVV JNJ LLY MSFT
News headline image
Meta Platforms’ Cloud Push: Growth Opportunity Versus AI Concerns ↗
Today 12:00 EDT
Via MarketBeat
Topics Artificial Intelligence
Tickers CRWV GOOGL META MSFT SPCX
News headline image
Why Penguin Solutions May Be the Smartest AI Infrastructure Stock ↗
Today 11:25 EDT
Via MarketBeat
Topics Artificial Intelligence
Tickers APLD IREN NBIS NVDA PENG

Recent Quotes

View More
Symbol Price Change (%)
AMZN  243.62
-2.36 (-0.96%)
AAPL  313.39
+2.73 (0.88%)
AMD  517.41
+1.30 (0.25%)
BAC  58.30
-1.56 (-2.61%)
GOOG  358.71
-4.91 (-1.35%)
META  603.12
-12.46 (-2.02%)
MSFT  383.34
-5.50 (-1.41%)
NVDA  204.12
+7.19 (3.65%)
ORCL  140.49
-1.11 (-0.78%)
TSLA  394.06
-8.84 (-2.19%)
Stock Quote API & Stock News API supplied by www.cloudquote.io
Quotes delayed at least 20 minutes.
By accessing this page, you agree to the Privacy Policy and Terms Of Service.
© 2025 FinancialContent. All rights reserved.

Having difficulty making your payments? We're here to help! Call 1-800-255-5897

Copyright © 2019 Franklin Credit Management Corporation
All Rights Reserved
Contact Us | Privacy Policy | Terms of Use | Sitemap