

In the realm of exchange-traded funds (ETFs), the Utilities Select Sector SPDR Fund (NYSE: XLU) is a prominent player, currently forming an attractive setup on a higher time frame that should warrant investor attention. Despite being slightly negative year-to-date, down 2.89%, the XLU is positioning itself for a potential breakout on a higher time frame, presenting an intriguing risk: reward set up for traders and investors.
Understanding the XLU
The XLU is designed to track the price and yield performance of the Utilities Select Sector of the S&P 500 Index. The index includes companies from industries such as electric utilities, multi-utilities, independent power producers and energy traders, and gas utilities. The fund utilizes a passive or indexing investment approach to attempt to approximate the investment performance of the index.
Examining The Trend Continuation Potential
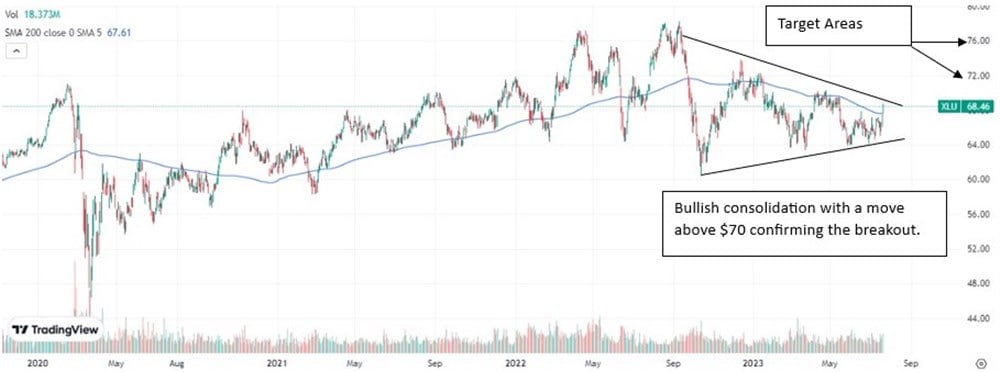
After bottoming out in March 2020, along with the overall market, the ETF has steadily recovered. In September 2022, XLU achieved a new all-time high (ATH) when the stock reached $78.22. However, since achieving a new ATH in 2022, the ETF has retraced and spent most of the year consolidating in a contracting range near its 200-day SMA.
With the ETF down 2.89% on the year, it might be time for the sector to catch up to the rest of the market. Although utility stocks tend to outperform during specific economic environments, like during economic downturns, low-interest rate environments, or periods of heightened uncertainty and market volatility, one cannot deny the particular technical setup that has emerged in the ETF. Click here to dive deeper into utility stocks' unique capabilities, drawbacks, and benefits.
As the ETF further contracts within a higher time frame consolidation, a potential breakout trade and investment opportunity has emerged. A breakout would be confirmed if the XLU can break out of the wedge and hold over the 200-day SMA. If buyers step higher and support the ETF over $70, momentum might work in their favor, and the ETF could trade to the next resistance level near $72 and then $74.
Looking Beyond the Chart: Monitoring Top Holdings
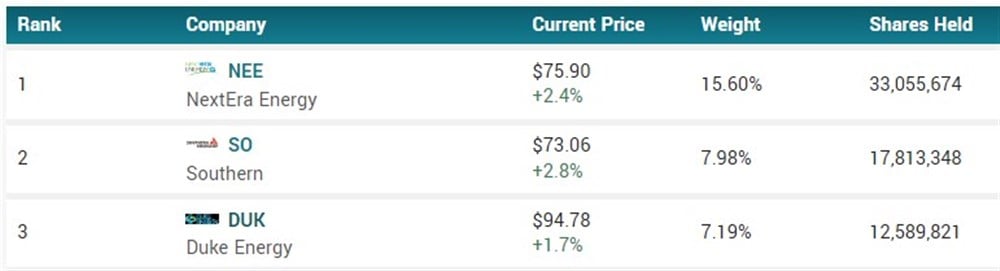
While focusing on the chart is crucial, it’s equally important to consider the ETF's top-weighted holdings, as they will heavily influence its overall performance. For XLU, the three dominant holdings are NextEra Energy (NYSE: NEE) with a 15.6% weighting, Southern (NYSE: SO) with a 7.98% weighting, and Duke Energy (NYSE: DUK) ranked third with a 7.19% weighting.
Market trends and technical patterns do not solely determine the performance of the XLU. Like the top-weighted names above, the underlying holdings significantly influence the ETF’s overall performance. They will have a magnified effect on the overall performance of the ETF as they represent a significant portion of the fund’s assets. Any notable movement in their stock prices can result in substantial fluctuations for the XLU.
It might be a good idea to assess the fundamentals and technicals of the top-weighted names of the XLU before investing in the ETF. In particular, note the dividend yield, financial metrics, analyst ratings and forecasts, and technical setup.