
Payroll and HR services provider Automatic Data Processing (NASDAQ: ADP) beat Wall Street’s revenue expectations in Q3 CY2025, with sales up 7.1% year on year to $5.18 billion. The company expects next quarter’s revenue to be around $5.33 billion, close to analysts’ estimates. Its non-GAAP profit of $2.49 per share was 1.9% above analysts’ consensus estimates.
Is now the time to buy ADP? Find out by accessing our full research report, it’s free for active Edge members.
ADP (ADP) Q3 CY2025 Highlights:
- Revenue: $5.18 billion vs analyst estimates of $5.13 billion (7.1% year-on-year growth, 0.9% beat)
- Adjusted EPS: $2.49 vs analyst estimates of $2.44 (1.9% beat)
- Adjusted EBITDA: $1.54 billion vs analyst estimates of $1.45 billion (29.7% margin, 5.9% beat)
- Revenue Guidance for Q4 CY2025 is $5.33 billion at the midpoint, roughly in line with what analysts were expecting
- Operating Margin: 25.8%, in line with the same quarter last year
- Free Cash Flow Margin: 11.5%, down from 15.8% in the same quarter last year
- Market Capitalization: $113.3 billion
Company Overview
Processing one out of every six paychecks in the United States, ADP (NASDAQ: ADP) provides cloud-based human capital management solutions that help businesses manage payroll, benefits, talent acquisition, and HR administration.
Revenue Growth
A company’s long-term sales performance is one signal of its overall quality. Even a bad business can shine for one or two quarters, but a top-tier one grows for years.
With $20.9 billion in revenue over the past 12 months, ADP is a behemoth in the business services sector and benefits from economies of scale, giving it an edge in distribution. This also enables it to gain more leverage on its fixed costs than smaller competitors and the flexibility to offer lower prices.
As you can see below, ADP’s sales grew at a solid 7.5% compounded annual growth rate over the last five years. This is a good starting point for our analysis because it shows ADP’s demand was higher than many business services companies.
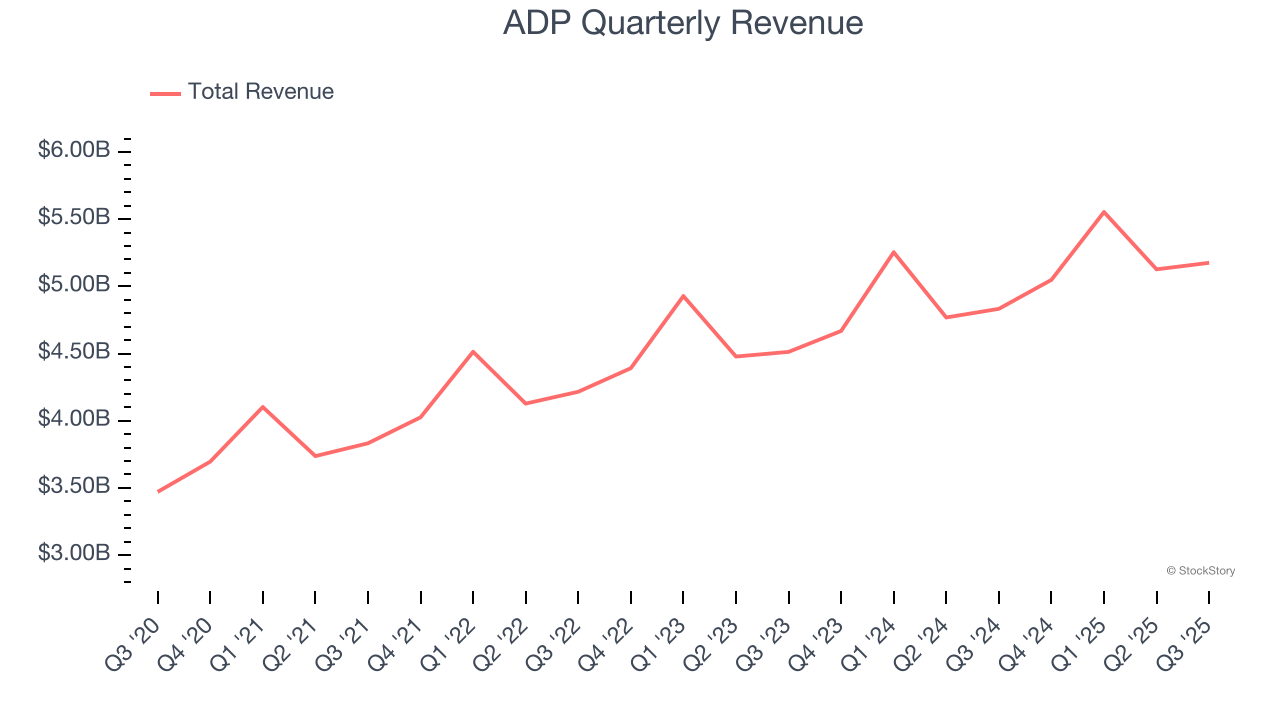
Long-term growth is the most important, but within business services, a half-decade historical view may miss new innovations or demand cycles. ADP’s annualized revenue growth of 6.9% over the last two years aligns with its five-year trend, suggesting its demand was stable. 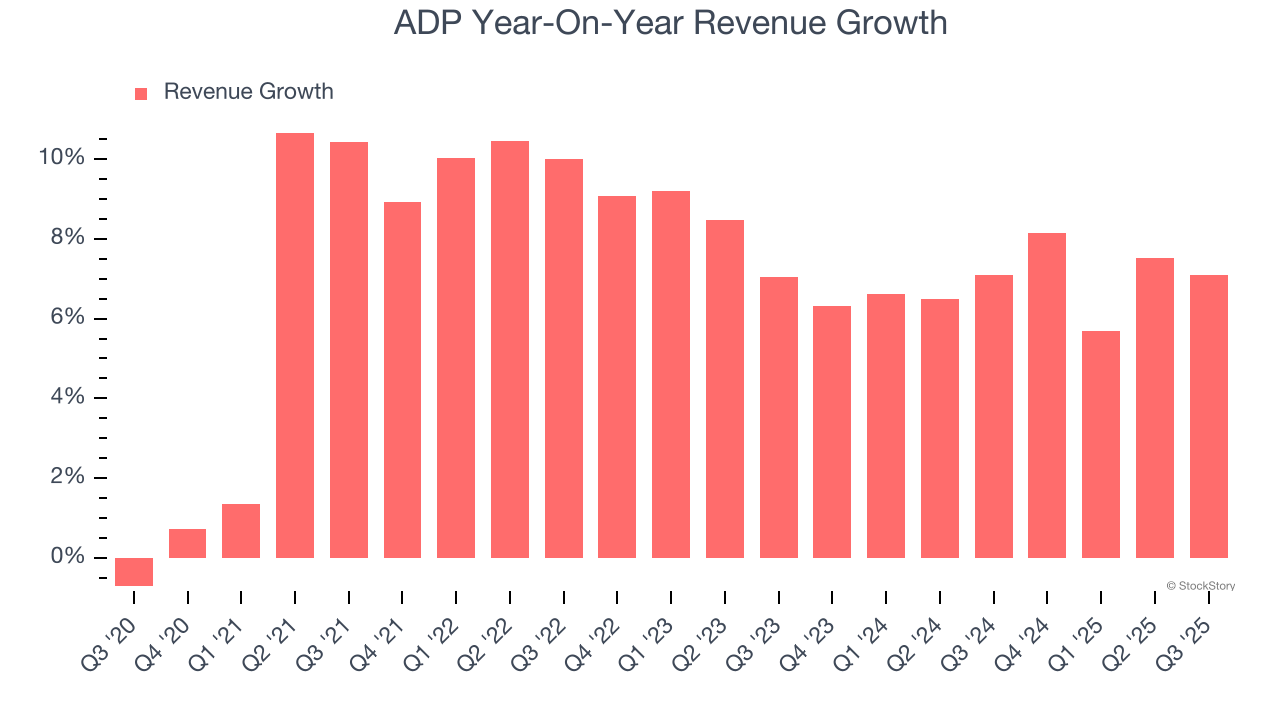
This quarter, ADP reported year-on-year revenue growth of 7.1%, and its $5.18 billion of revenue exceeded Wall Street’s estimates by 0.9%. Company management is currently guiding for a 5.5% year-on-year increase in sales next quarter.
Looking further ahead, sell-side analysts expect revenue to grow 5.4% over the next 12 months, similar to its two-year rate. We still think its growth trajectory is satisfactory given its scale and suggests the market sees success for its products and services.
Here at StockStory, we certainly understand the potential of thematic investing. Diverse winners from Microsoft (MSFT) to Alphabet (GOOG), Coca-Cola (KO) to Monster Beverage (MNST) could all have been identified as promising growth stories with a megatrend driving the growth. So, in that spirit, we’ve identified a relatively under-the-radar profitable growth stock benefiting from the rise of AI, available to you FREE via this link.
Operating Margin
Operating margin is an important measure of profitability as it shows the portion of revenue left after accounting for all core expenses – everything from the cost of goods sold to advertising and wages. It’s also useful for comparing profitability across companies with different levels of debt and tax rates because it excludes interest and taxes.
ADP has been a well-oiled machine over the last five years. It demonstrated elite profitability for a business services business, boasting an average operating margin of 24.8%.
Looking at the trend in its profitability, ADP’s operating margin rose by 3.7 percentage points over the last five years, as its sales growth gave it operating leverage.
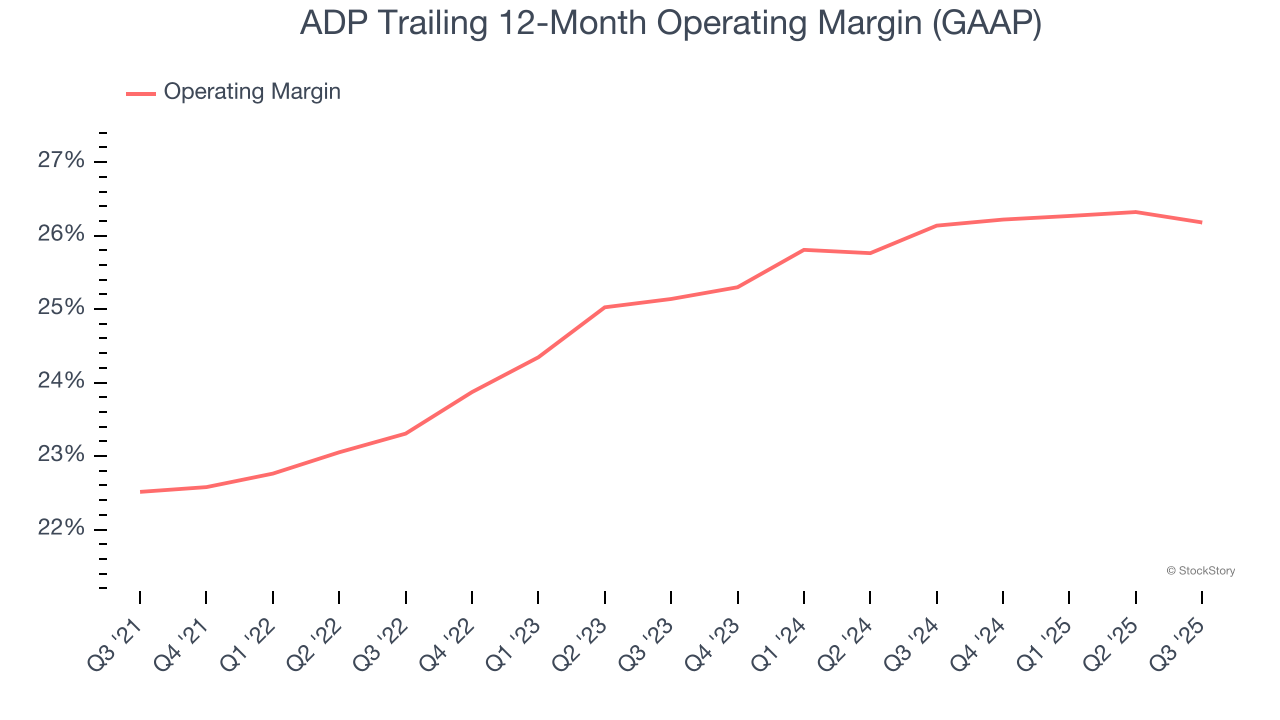
This quarter, ADP generated an operating margin profit margin of 25.8%, in line with the same quarter last year. This indicates the company’s overall cost structure has been relatively stable.
Earnings Per Share
Revenue trends explain a company’s historical growth, but the long-term change in earnings per share (EPS) points to the profitability of that growth – for example, a company could inflate its sales through excessive spending on advertising and promotions.
ADP’s EPS grew at a remarkable 11.1% compounded annual growth rate over the last five years, higher than its 7.5% annualized revenue growth. This tells us the company became more profitable on a per-share basis as it expanded.
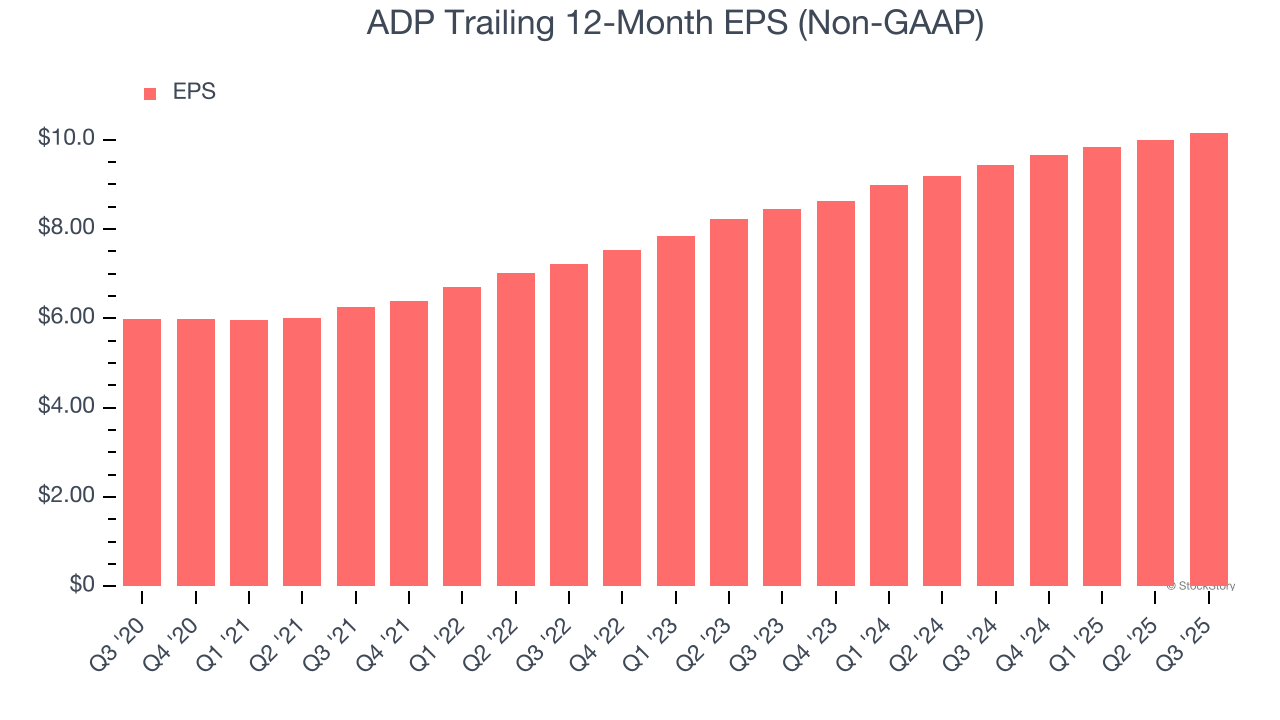
We can take a deeper look into ADP’s earnings quality to better understand the drivers of its performance. As we mentioned earlier, ADP’s operating margin was flat this quarter but expanded by 3.7 percentage points over the last five years. On top of that, its share count shrank by 5.5%. These are positive signs for shareholders because improving profitability and share buybacks turbocharge EPS growth relative to revenue growth. 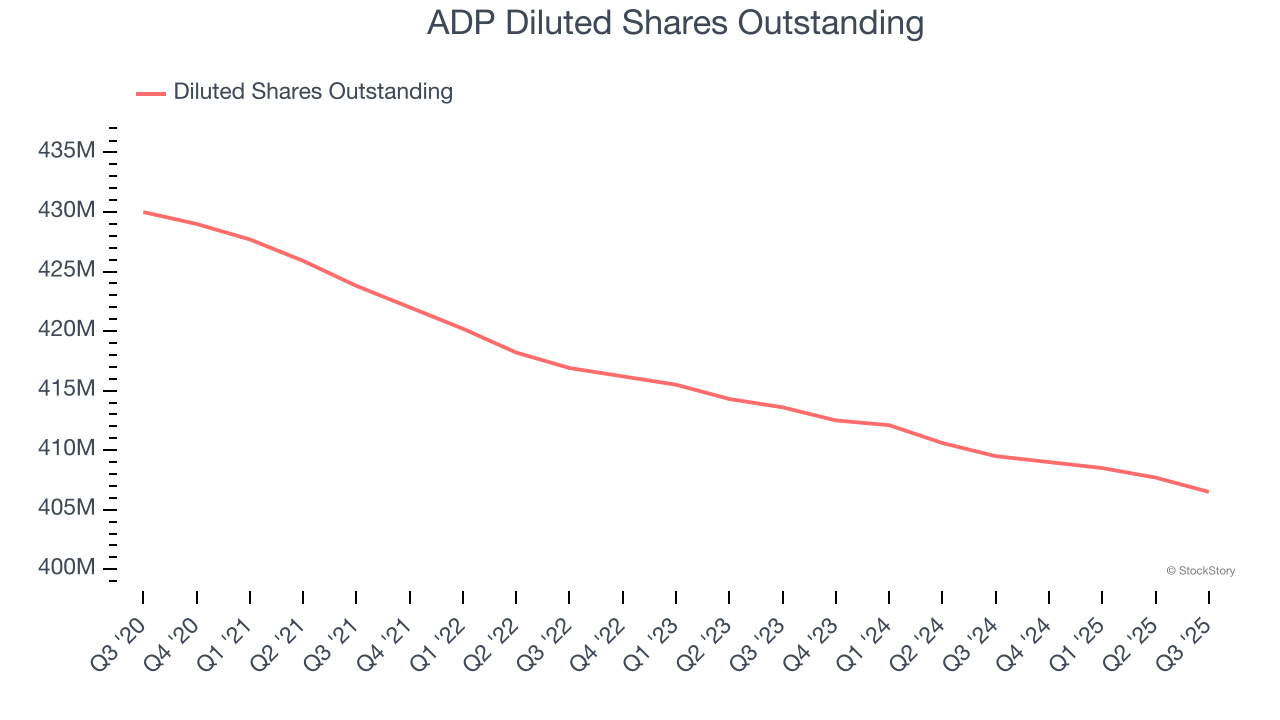
Like with revenue, we analyze EPS over a more recent period because it can provide insight into an emerging theme or development for the business.
For ADP, its two-year annual EPS growth of 9.7% was lower than its five-year trend. This wasn’t great, but at least the company was successful in other measures of financial health.
In Q3, ADP reported adjusted EPS of $2.49, up from $2.33 in the same quarter last year. This print beat analysts’ estimates by 1.9%. Over the next 12 months, Wall Street expects ADP’s full-year EPS of $10.16 to grow 10.2%.
Key Takeaways from ADP’s Q3 Results
It was good to see ADP narrowly top analysts’ revenue expectations this quarter. We were also glad its EPS outperformed Wall Street’s estimates. On the other hand, its revenue guidance for next quarter was just in line, showing that this quarter's business momentum isn't carrying over as strongly into next quarter. Zooming out, we think this was a mixed quarter. Investors were likely hoping for more, and shares traded down 1.3% to $275.93 immediately following the results.
So do we think ADP is an attractive buy at the current price? If you’re making that decision, you should consider the bigger picture of valuation, business qualities, as well as the latest earnings. We cover that in our actionable full research report which you can read here, it’s free for active Edge members.