Although Texas Instruments (currently trading at $181.42 per share) has gained 7% over the last six months, it has trailed the S&P 500’s 22.7% return during that period. This may have investors wondering how to approach the situation.
Is now the time to buy Texas Instruments, or should you be careful about including it in your portfolio? Check out our in-depth research report to see what our analysts have to say, it’s free for active Edge members.
Why Is Texas Instruments Not Exciting?
We don't have much confidence in Texas Instruments. Here are three reasons why TXN doesn't excite us and a stock we'd rather own.
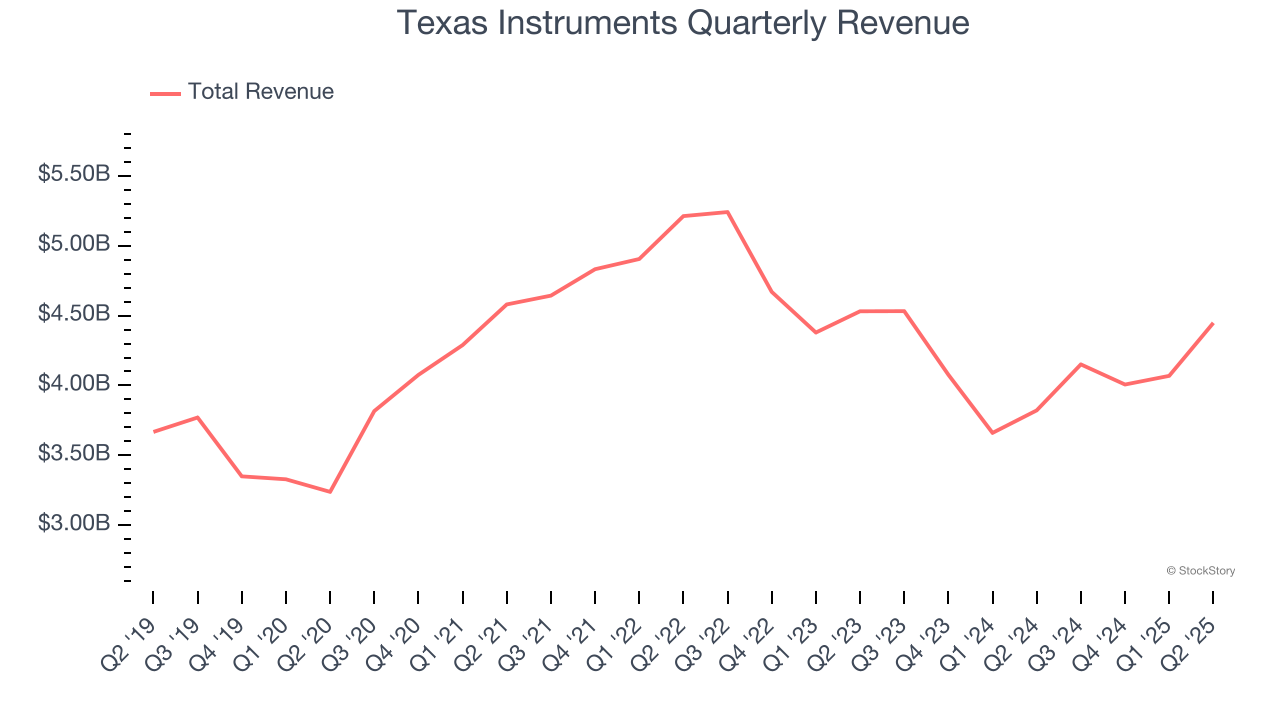
1. Long-Term Revenue Growth Disappoints
A company’s long-term sales performance can indicate its overall quality. Any business can put up a good quarter or two, but many enduring ones grow for years. Regrettably, Texas Instruments’s sales grew at a mediocre 4% compounded annual growth rate over the last five years. This fell short of our benchmark for the semiconductor sector. Semiconductors are a cyclical industry, and long-term investors should be prepared for periods of high growth followed by periods of revenue contractions.
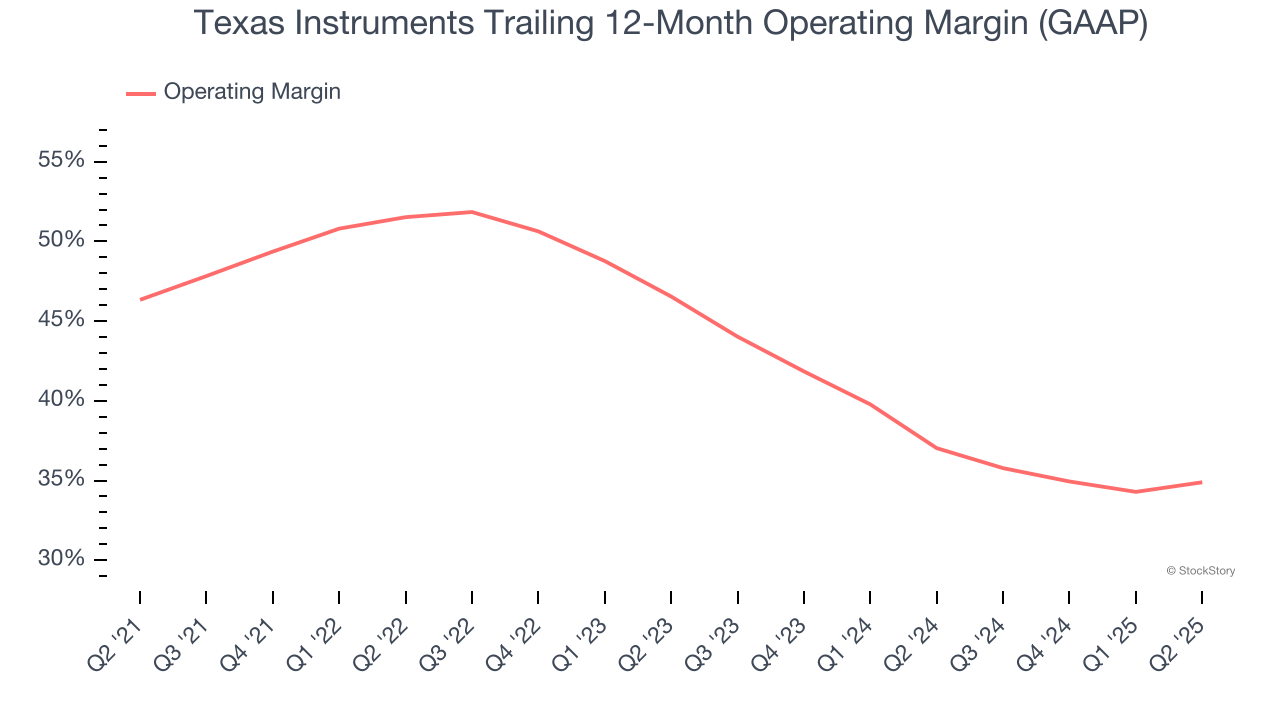
2. Shrinking Operating Margin
Operating margin is an important measure of profitability as it shows the portion of revenue left after accounting for all core expenses – everything from the cost of goods sold to advertising and wages. It’s also useful for comparing profitability across companies with different levels of debt and tax rates because it excludes interest and taxes.
Analyzing the trend in its profitability, Texas Instruments’s operating margin decreased by 11.4 percentage points over the last five years. This raises questions about the company’s expense base because its revenue growth should have given it leverage on its fixed costs, resulting in better economies of scale and profitability. Its operating margin for the trailing 12 months was 34.9%.
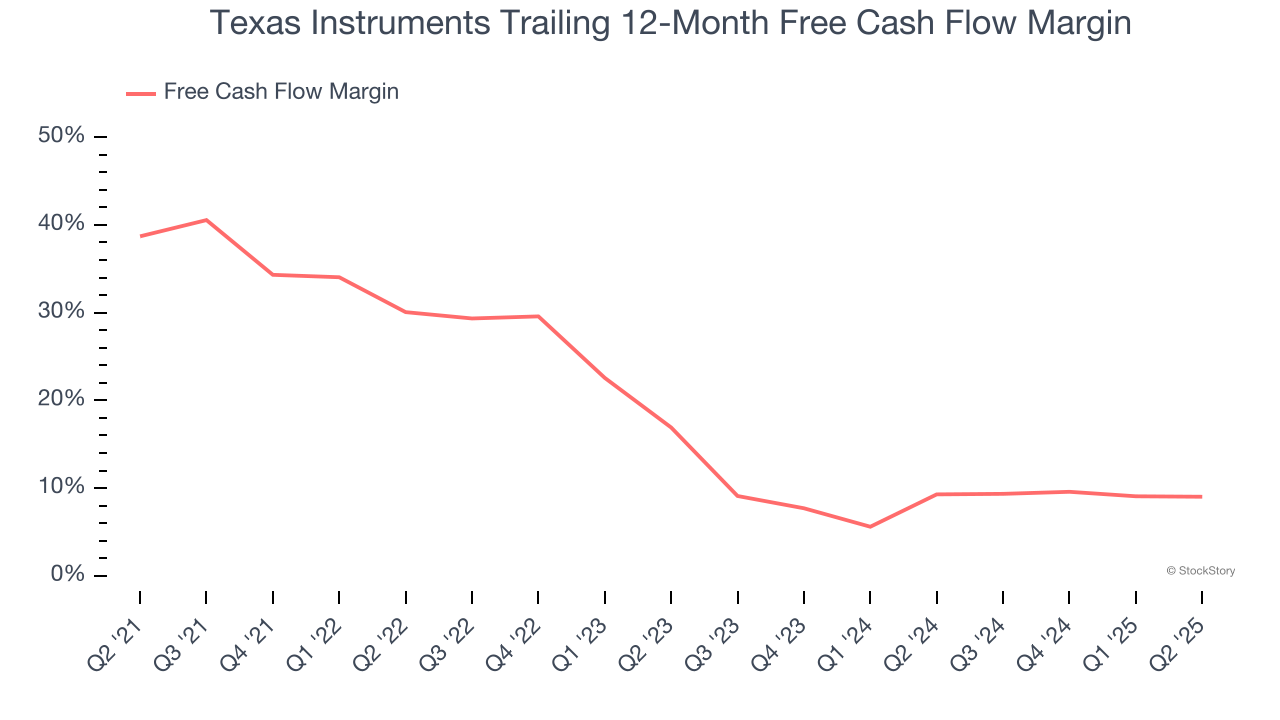
3. Free Cash Flow Margin Dropping
If you’ve followed StockStory for a while, you know we emphasize free cash flow. Why, you ask? We believe that in the end, cash is king, and you can’t use accounting profits to pay the bills.
As you can see below, Texas Instruments’s margin dropped by 29.7 percentage points over the last five years. This along with its unexciting margin put the company in a tough spot, and shareholders are likely hoping it can reverse course. If the trend continues, it could signal it’s becoming a more capital-intensive business. Texas Instruments’s free cash flow margin for the trailing 12 months was 9%.
Final Judgment
Texas Instruments isn’t a terrible business, but it doesn’t pass our quality test. With its shares lagging the market recently, the stock trades at 29.9× forward P/E (or $181.42 per share). This valuation multiple is fair, but we don’t have much faith in the company. We're fairly confident there are better stocks to buy right now. Let us point you toward the Amazon and PayPal of Latin America.
Stocks We Like More Than Texas Instruments
Trump’s April 2025 tariff bombshell triggered a massive market selloff, but stocks have since staged an impressive recovery, leaving those who panic sold on the sidelines.
Take advantage of the rebound by checking out our Top 9 Market-Beating Stocks. This is a curated list of our High Quality stocks that have generated a market-beating return of 183% over the last five years (as of March 31st 2025).
Stocks that made our list in 2020 include now familiar names such as Nvidia (+1,545% between March 2020 and March 2025) as well as under-the-radar businesses like the once-micro-cap company Kadant (+351% five-year return). Find your next big winner with StockStory today.
StockStory is growing and hiring equity analyst and marketing roles. Are you a 0 to 1 builder passionate about the markets and AI? See the open roles here.