• Image 01
  • Image 02
  • Image 03
  • Image 04
  • Image 05
  • Image 06
Need assistance? Contact Us: 1-800-255-5897

Menu

  • Home
  • About Us
    • Company Overview
    • Management Team
    • Board of Directors
  • Your Loan Service Center
  • MAKE A PAYMENT
  • Business Service Center
  • Contact Us
  • Home
  • About Us
    • Company Overview
    • Management Team
    • Board of Directors
  • Your Loan Service Center
  • MAKE A PAYMENT
  • Business Service Center
  • Contact Us
Recent Quotes
View Full List
My Watchlist
Create Watchlist
Indicators
DJI
Nasdaq Composite
SPX
Gold
Crude Oil
Markets
Stocks
ETFs
Tools
Markets:
Overview
News
Currencies
International
Treasuries

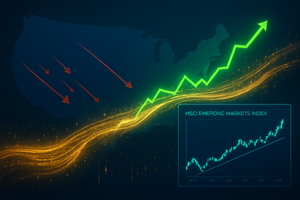
MSCI EM ETF (NY:IEMG)

67.39 +0.45 (+0.67%)
Official Closing Price Updated: 8:00 PM EST, Dec 26, 2025 Add to My Watchlist
Quote
Overview Detailed Quote Charting Historical Prices
News
All News News Headlines Press Releases
Research
Quarterly Reports Insider Filings Other Filings

Price and Volume

Detailed Quote
Volume 7,087,709
Open 67.10
Bid (Size) 67.00 (100)
Ask (Size) 67.67 (2,000)
Prev. Close 66.94
Today's Range 67.01 - 67.39
52wk Range 47.29 - 69.47
Shares Outstanding 16,242,000
Dividend Yield 2.11%
Chart for  (: )
Intraday 1 Week 1 Month 3 Month 1 Year 3 Year 5 Year

Top News

More News
News headline image
IEMG Offers Broader Emerging Markets Exposure Than SCHE ↗
December 23, 2025
Explore how differences in fund size, diversification, and costs may influence your choice between these two emerging markets ETFs. 
Via The Motley Fool
Topics ETFs
News headline image
Vanguard vs. iShares: Is VWO or IEMG the Better Emerging Markets ETF? ↗
December 21, 2025
Subtle differences in cost, holdings, and risk profiles set these two emerging markets ETFs apart for globally minded investors. 
Via The Motley Fool
Topics ETFs

Performance

YTD
+29.3%
+29.3%
1 Month
+0.7%
+0.7%
3 Month
+3.4%
+3.4%
6 Month
+12.8%
+12.8%
1 Year
+27.3%
+27.3%

More News

Read More
News headline image
This Rare Signal Says Emerging Markets Could Be Entering a Multi-Year Outperformance Cycle ↗
December 21, 2025
Via The Motley Fool
Topics ETFs
News headline image
BRICS Outpaces G7, The Undeniable Economic Rebalancing ↗
November 18, 2025
Via Benzinga
News headline image
Why Bessent's Tariff Talk Puts Dollar-Sensitive Stocks On Edge ↗
September 16, 2025
Via Benzinga
News headline image
MSCI Set To Shakes Up Global ETF Lineups — SoFi, Affirm, Rocket Lab Join ↗
August 13, 2025
Via Benzinga
Topics ETFs
News headline image
Myriad Dumps 129,848 Alibaba (BABA) Shares in Q2 ↗
July 31, 2025
Via The Motley Fool
Topics Artificial Intelligence Regulatory Compliance
News headline image
Wall Street Is On Fire—So Why Is This Wall Of Cash Moving Abroad? ↗
July 08, 2025
Via Benzinga
Topics ETFs
News headline image
Asia And Europe Markets Mixed, Dollar Near 3-Year Lows - Global Markets Today While US Slept ↗
July 03, 2025
Via Benzinga
News headline image
A Weaker Dollar Just Unlocked A Surprise 2025 Winner — And Smart Money Is Moving In ↗
June 30, 2025
Via Benzinga
News headline image
Asia Markets Mixed, Europe Edges Lower, Dollar Weakens On Rate Cut Bets - Global Markets Today While US Slept ↗
June 30, 2025
Via Benzinga
Topics Economy Stocks
News headline image
Asia Markets Mixed, Europe Rises While Dollar Gains - Global Markets Today While US Slept ↗
July 02, 2025
Via Benzinga
Topics Economy Stocks
News headline image
Asia Markets Mixed, Europe Advances, Gold And Dollar Slip Further - Global Markets Today While US Slept ↗
June 27, 2025
Via Benzinga
News headline image
Asia Markets Mixed, Europe Slips, Dollar Weakens Further As Tariff Deadline Looms - Global Markets Today While US Slept ↗
July 01, 2025
Via Benzinga
Topics Economy
News headline image
Asia Up, Europe Markets Slip, Dollar Under Pressure On Increased Risk Appetite - Global Markets Today While US Slept ↗
June 25, 2025
Via Benzinga
Topics Economy
News headline image
Asia Markets Mixed, Europe Gains, Dollar Hit by Fed Concerns And Cooling Inflation - Global Markets Today While US Slept ↗
June 26, 2025
Via Benzinga
Topics Economy Stocks
News headline image
Global Markets Rally, Oil Plunges On Ceasefire Optimism ↗
June 24, 2025
Via Benzinga
News headline image
Asia Markets Mixed, Europe Slips As Oil Hits $75 - Global Markets Today While US Slept ↗
June 23, 2025
Via Benzinga
Topics Economy Stocks
News headline image
Asia And Europe Markets Mixed, Dollar Pressured Amid Middle East Tensions - Global Markets Today While US Slept ↗
June 18, 2025
Via Benzinga
News headline image
Asia And Europe Markets In Red, Oil Spikes On Geopolitical Tensions - Global Markets Today While US Slept ↗
June 17, 2025
Via Benzinga
Topics Economy
News headline image
Asia And Europe Markets Rise, Dollar Slips Ahead Of Central Bank Decisions - Global Markets Today While US Slept ↗
June 16, 2025
Via Benzinga
Topics Economy
News headline image
Global Markets Slide As Iran-Israel Conflict Heats Up, Oil Soars ↗
June 13, 2025
Via Benzinga
Topics Energy Government Stocks
News headline image
Asia And Europe Markets Advance, Oil Hits 7-Week High - Global Markets Today While US Slept ↗
June 11, 2025
Via Benzinga
News headline image
Asia And Europe Markets Slide, Dollar Softens On Inflation Data And Geopolitical Worries - Global Markets Today While US Slept ↗
June 12, 2025
Via Benzinga
Topics Economy
News headline image
Asia And Europe Markets Mixed, Dollar Gains - Global Markets Today While US Slept ↗
June 10, 2025
Via Benzinga
Topics Economy Stocks

Frequently Asked Questions

Is MSCI EM ETF publicly traded?
Yes, MSCI EM ETF is publicly traded.
What exchange does MSCI EM ETF trade on?
MSCI EM ETF trades on the New York Stock Exchange
What is the ticker symbol for MSCI EM ETF?
The ticker symbol for MSCI EM ETF is IEMG on the New York Stock Exchange
What is the current price of MSCI EM ETF?
The current price of MSCI EM ETF is 67.39
When was MSCI EM ETF last traded?
The last trade of MSCI EM ETF was at 12/26/25 08:00 PM ET
What is the market capitalization of MSCI EM ETF?
The market capitalization of MSCI EM ETF is 1.09B
How many shares of MSCI EM ETF are outstanding?
MSCI EM ETF has 1B shares outstanding.
Stock Quote API & Stock News API supplied by www.cloudquote.io
Quotes delayed at least 20 minutes.
By accessing this page, you agree to the Privacy Policy and Terms Of Service.
© 2025 FinancialContent. All rights reserved.

Having difficulty making your payments? We're here to help! Call 1-800-255-5897

Copyright © 2019 Franklin Credit Management Corporation
All Rights Reserved
Contact Us | Privacy Policy | Terms of Use | Sitemap