SINGAPORE, Sept 4, 2025 - (ACN Newswire) - The Asia Unicorn Forum (AUF), a future-shaping organisation dedicated to advancing technological innovation and sustainable growth among Asia’s unicorn companies, had published its 2024 Asia Unicorn Development Report in May 2025.
The report identifies China, India, and Israel as Asia’s top three nations by unicorn count, with China holding a commanding lead.
“While unicorns have long been a focus in investment circles, we now recognise them as a distinct economic phenomenon," said Mr Liu Yanlong (刘彦龙), Executive Chairman of AUF, emphasising the report’s groundbreaking approach and methodology.
"For the first time, we define unicorns as part of a standalone unicorn economy. Unlike other reports, we analysed 59 metrics across six categories—entrepreneurship, business model innovation, technological edge, capital strength, and more—to uncover the unique drivers of Asian unicorns.
"We’ve identified a replicable strategic pattern: the Creating Neo-Market Strategy (CNM). Unicorns aren’t just great companies; they pioneer entirely new market categories and become transformative forces."
Key Findings
1. Landscape for Unicorns
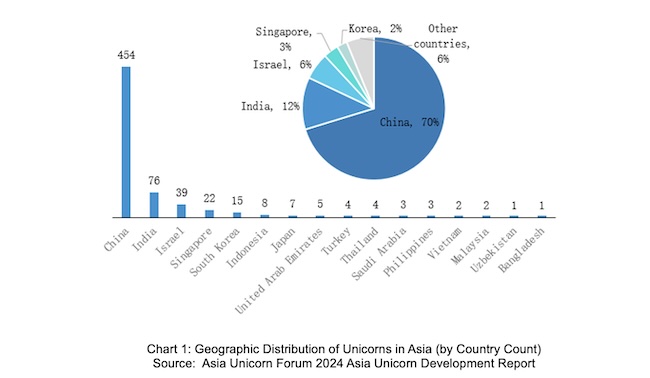
- Asia is home to 646 unicorns (startups valued at more than US$1.0 billion) with a combined valuation of US$2.4 trillion (average US$37.0 billion per company), spanning 16 countries and 11 industries.
- China dominates with 454 unicorns (70% of Asia’s total), followed by India (12%) and Israel. Only five countries — China, India, Israel, Singapore, and South Korea — have over 10 unicorns each (see Chart 1).
2. 2024 Asia Top 100 Unicorns
- China claims 75 spots, India 11, and Israel 6, collectively representing 92% of the list.
3. Valuation Insights
- Total Valuation: China’s unicorns account for US$1.74 trillion (73% of Asia’s total), while India’s total is US$281.8 billion (12%).
- Average Valuation: China, Singapore, the UAE, and Vietnam exceed Asia’s average of US$37 billion (see Chart 2).
4. Industry Breakdown:
- China’s unicorns lead in software, transportation, key and core technology, consumer, fintech, and media/entertainment, each surpassing US$100 billion in total valuation. India’s software sector is its sole industry crossing this threshold.
- Israel (software) and Singapore (consumer) show notable valuations (see Chart 3).
5. Emerging Unicorns:
- 73 new unicorns emerged in 2024, including 10 companies that achieved unicorn status within one year—far outpacing the traditional 10-year trajectory. Eight of these are Chinese companies.
6. Business Models:
- Platform-based (43%) and technology-driven (42%) models dominate Asia’s unicorn ecosystem.
Future Trends
- Tech Convergence: IT and biotech will increasingly merge, with growth extending into new energy and advanced materials.
- Regionalisation: Amid global fragmentation, Asian unicorns will face intensified regional competition and collaboration.
- AI & Energy: Unicorns in these sectors are poised to surge, reshaping Asia’s energy landscape.
Report Availability
The 300-page 2024 Asia Unicorn Development Report offers in-depth analysis of success patterns and regional drivers. For details, visit AUF’s official WeChat channel (Asia Unicorn AUF) or email auf@auforum.org.
Charts Referenced
1. Chart 1: Geographic Distribution of Unicorns in Asia (by Country Count)
2. Chart 2: Total and Average Valuation of Asian Unicorns by Country

3. Chart 3: Bubble Chart of Total Valuation Distribution by Country and Industry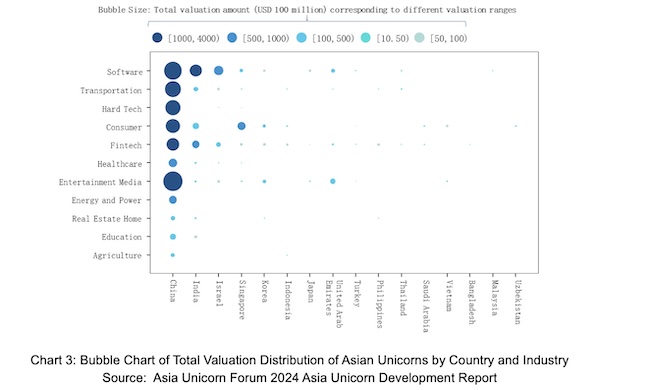
For media and any queries, please contact:
AUF Secretariat
Email: auf@auforum.org
Source: Asia Unicorn Forum (AUF)
Copyright 2025 ACN Newswire . All rights reserved.


