Texas Instruments Incorporated (TXN), based in Dallas, Texas, is a global semiconductor company specializing in designing and manufacturing analog and embedded processing chips. Their products serve diverse markets like automotive, industrial, personal electronics, and communications equipment. Texas Instruments operates manufacturing sites and sales offices worldwide, focusing on innovation, efficiency, and customer-driven semiconductor solutions. The company has a market capitalization of $145.88 billion.
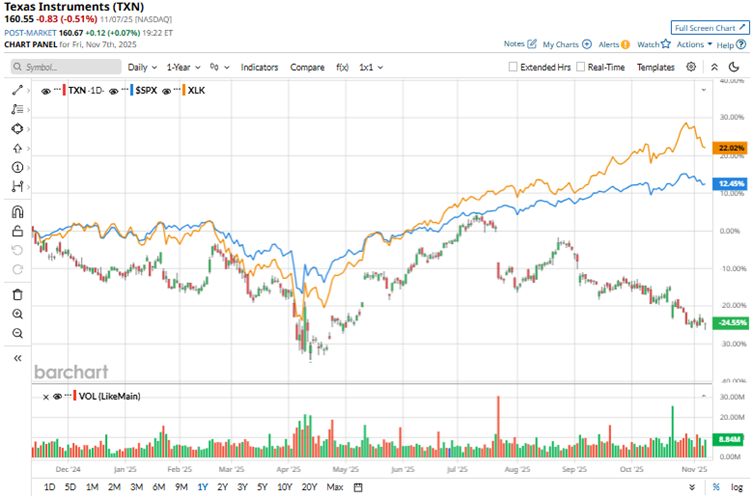
Factors such as supply chain constraints, global economic uncertainty, and a slowdown in demand for consumer electronics have impacted Texas Instruments’ stock trajectory. Over the past 52 weeks, the stock has declined 26.2%, while it has decreased by 2.6% over the past six months. It had reached a 52-week high of $221.69 in July, but is down 27.6% from that level.
The stock’s subdued performance has broadly underperformed the S&P 500 Index ($SPX), which has gained 12.7% over the past 52 weeks and 19.5% over the past six months. Turning our focus to the company’s own tech sector, we see that the stock has underperformed here as well, while the Technology Select Sector SPDR Fund (XLK) is up 21.4% over the past 52 weeks and 33.5% over the past six months.
On Oct. 21, Texas Instruments reported its third-quarter results for fiscal 2025. The company reported strength in its end-markets, resulting in a 14% year-over-year (YOY) increase in revenue to $4.74 billion. This was also higher than the $4.65 billion that Wall Street analysts had expected. Including a 10-cent reduction that was not in the company’s expectation, Texas Instruments’ EPS increased only 1% YOY to $1.48, slightly higher than the $1.47 that analysts had expected.
Despite this, Texas Instruments’ stock dropped 5.6% intraday on Oct. 22. This was due to the company’s Q4 projections falling short of analyst expectations as tariff uncertainty still clouds the analog chip market. It expects quarterly revenue to be in the range of $4.22 billion to $4.58 billion, which is lower than the expected figure of $4.51 billion. Texas Instruments expects EPS in the range of $1.13 to $1.39, which is below estimates of $1.41.
For the fiscal year 2025, which ends in December 2025, Wall Street analysts expect Texas Instruments’ EPS to grow 5.8% YOY to $5.50 on a diluted basis. Moreover, EPS is expected to increase 11.3% annually to $6.12 in fiscal 2026. The company has a solid history of surpassing consensus estimates, topping them in each of the four trailing quarters.
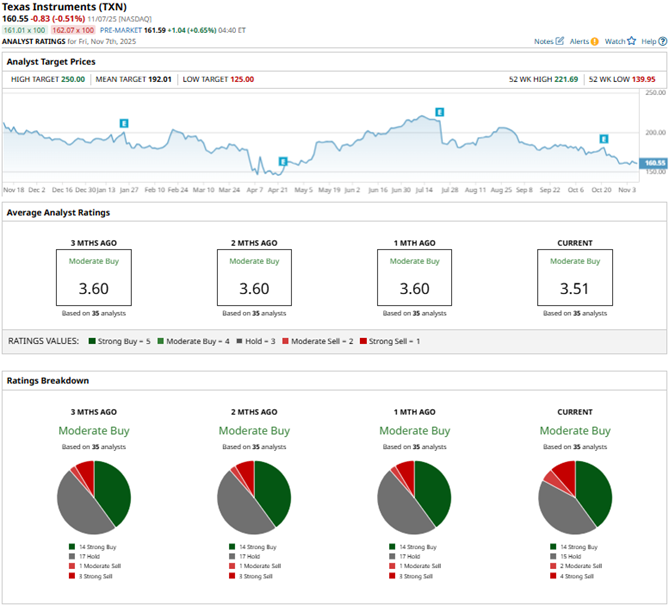
Among the 35 Wall Street analysts covering Texas Instruments’ stock, the consensus is a “Moderate Buy.” That’s based on 14 “Strong Buy” ratings, 15 “Holds,” two “Moderate Sells,” and four “Strong Sells.” The ratings configuration has become more bearish over the past month, with four “Strong Sell” ratings now, up from three previously.
Last month, analysts at TD Cowen maintained a “Buy” rating on the stock. However, the firm also lowered the price target on the stock from $210 to $200. TD Cowen analysts cited factors such as seasonality effects, increased depreciation, and underutilization, as the company has finished building its inventory, creating a headwind for its gross margin.
Texas Instruments’ mean price target of $192.01 indicates a 19.6% upside over current market prices. The Street-high price target of $250 implies a potential upside of 55.7%.
On the date of publication, Anushka Mukherjee did not have (either directly or indirectly) positions in any of the securities mentioned in this article. All information and data in this article is solely for informational purposes. For more information please view the Barchart Disclosure Policy here.
More news from Barchart


