HCA Healthcare, Inc. (HCA), headquartered in Nashville, Tennessee, owns and operates hospitals and related healthcare entities. Valued at $107.9 billion by market cap, the company provides diagnosis, treatments, consultancy, nursing, surgeries, and other services, as well as medical education, physician resource centers, and training programs.
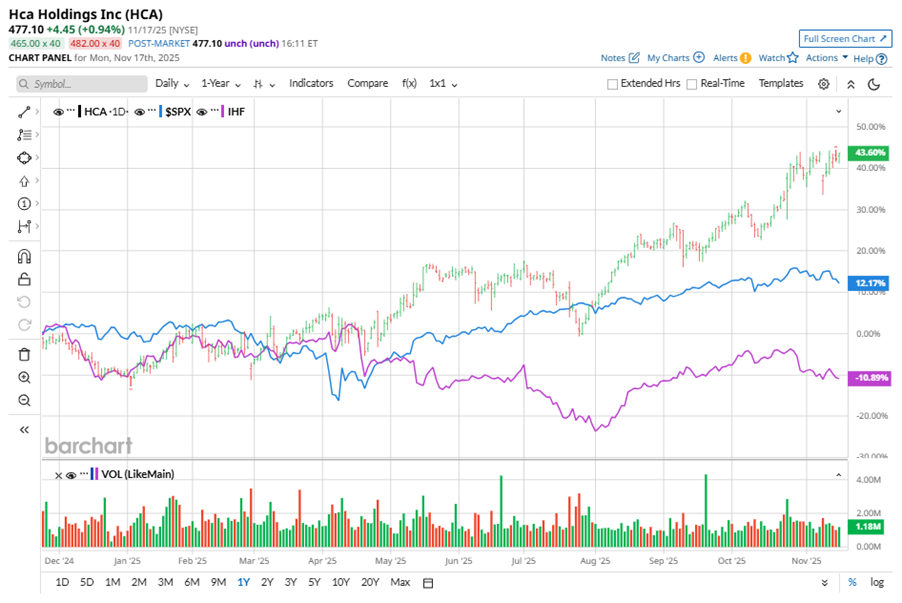
Shares of this healthcare service provider have outperformed the broader market over the past year. HCA has gained 39.1% over this time frame, while the broader S&P 500 Index ($SPX) has rallied nearly 13.7%. In 2025, HCA’s stock rose 59%, surpassing the SPX’s 13.4% rise on a YTD basis.
Zooming in further, HCA’s outperformance is also apparent compared to the iShares U.S. Healthcare Providers ETF (IHF). The exchange-traded fund has declined about 9.1% over the past year. Moreover, HCA’s double-digit gains on a YTD basis outshine the ETF’s marginal losses over the same time frame.
HCA's outperformance is attributed to increased Medicaid supplemental payments and strong volume growth, coupled with disciplined cost controls and operational efficiency. The company's revenue growth was boosted by higher Medicaid state supplemental program payments, particularly from Tennessee, Kansas, and Texas. With a focus on investing in digital tools and workforce development, HCA expects stable demand and continued operational efficiency, navigating policy uncertainties while driving long-term growth.
On Oct. 24, HCA shares closed up by 1.6% after reporting its Q3 results. Its adjusted EPS of $6.96 topped Wall Street expectations of $5.65. The company’s revenue was $19.2 billion, topping Wall Street forecasts of $18.5 billion. HCA expects full-year EPS to be $27 to $28, and expects revenue in the range of $75 billion to $76.5 billion.
For the current fiscal year, ending in December, analysts expect HCA’s EPS to grow 25.8% to $27.62 on a diluted basis. The company’s earnings surprise history is impressive. It beat the consensus estimate in each of the last four quarters.
Among the 26 analysts covering HCA stock, the consensus is a “Moderate Buy.” That’s based on 15 “Strong Buy” ratings, two “Moderate Buys,” and nine “Holds.”
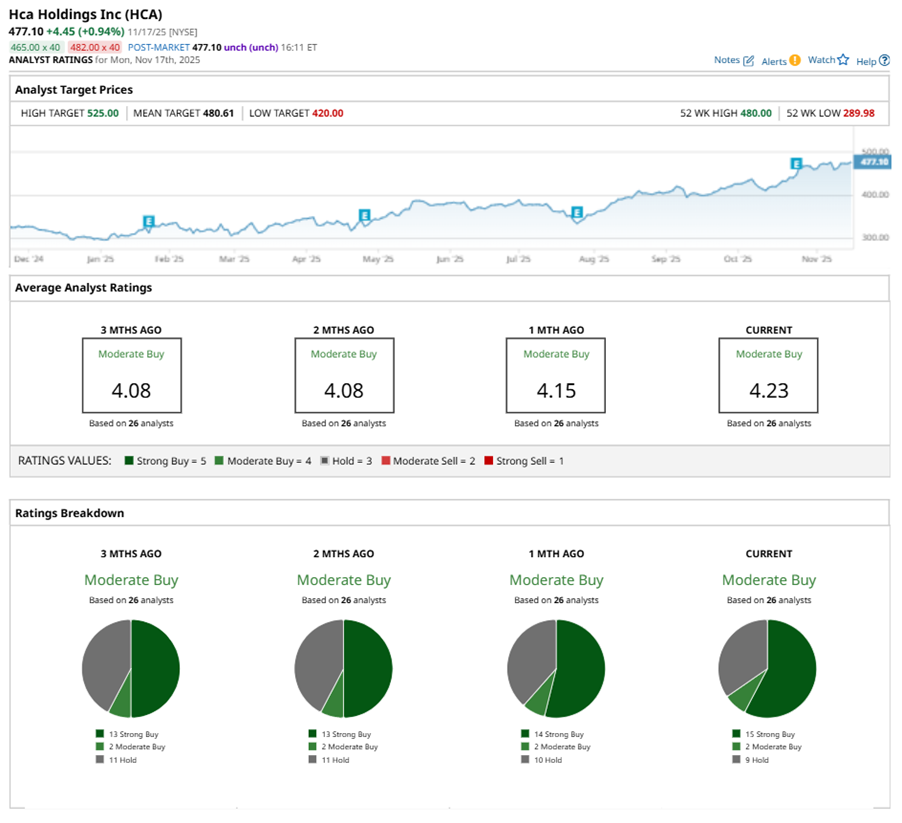
This configuration is more bullish than a month ago, with 14 analysts suggesting a “Strong Buy.”
On Nov. 13, Wells Fargo & Company (WFC) kept an “Equal Weight” rating on HCA and raised the price target to $431.
The mean price target of $480.61 represents a marginal premium to HCA’s current price levels. The Street-high price target of $525 suggests an upside potential of 10%.
On the date of publication, Neha Panjwani did not have (either directly or indirectly) positions in any of the securities mentioned in this article. All information and data in this article is solely for informational purposes. For more information please view the Barchart Disclosure Policy here.
More news from Barchart
- S&P Futures Slip on Souring Risk Sentiment
- Think AI Stocks Are Overvalued? Invest in These Data Center Power Trades for the Next Growth Phase.
- This High-Yield Dividend Stock Is Beaten Down, But Wall Street Still Loves It
- Unusual Options Activity Shows 71,000 Calls Hit the Tape for Applied Digital Stock – How You Should Play APLD Here


