Valued at a market cap of $63.7 billion, Norfolk Southern Corporation (NSC) is a transportation company which provides rail freight services. The Atlanta, Georgia-based company’s network plays a critical role in supply chains for industries like agriculture, consumer goods, automotive, chemicals, metals and construction materials.
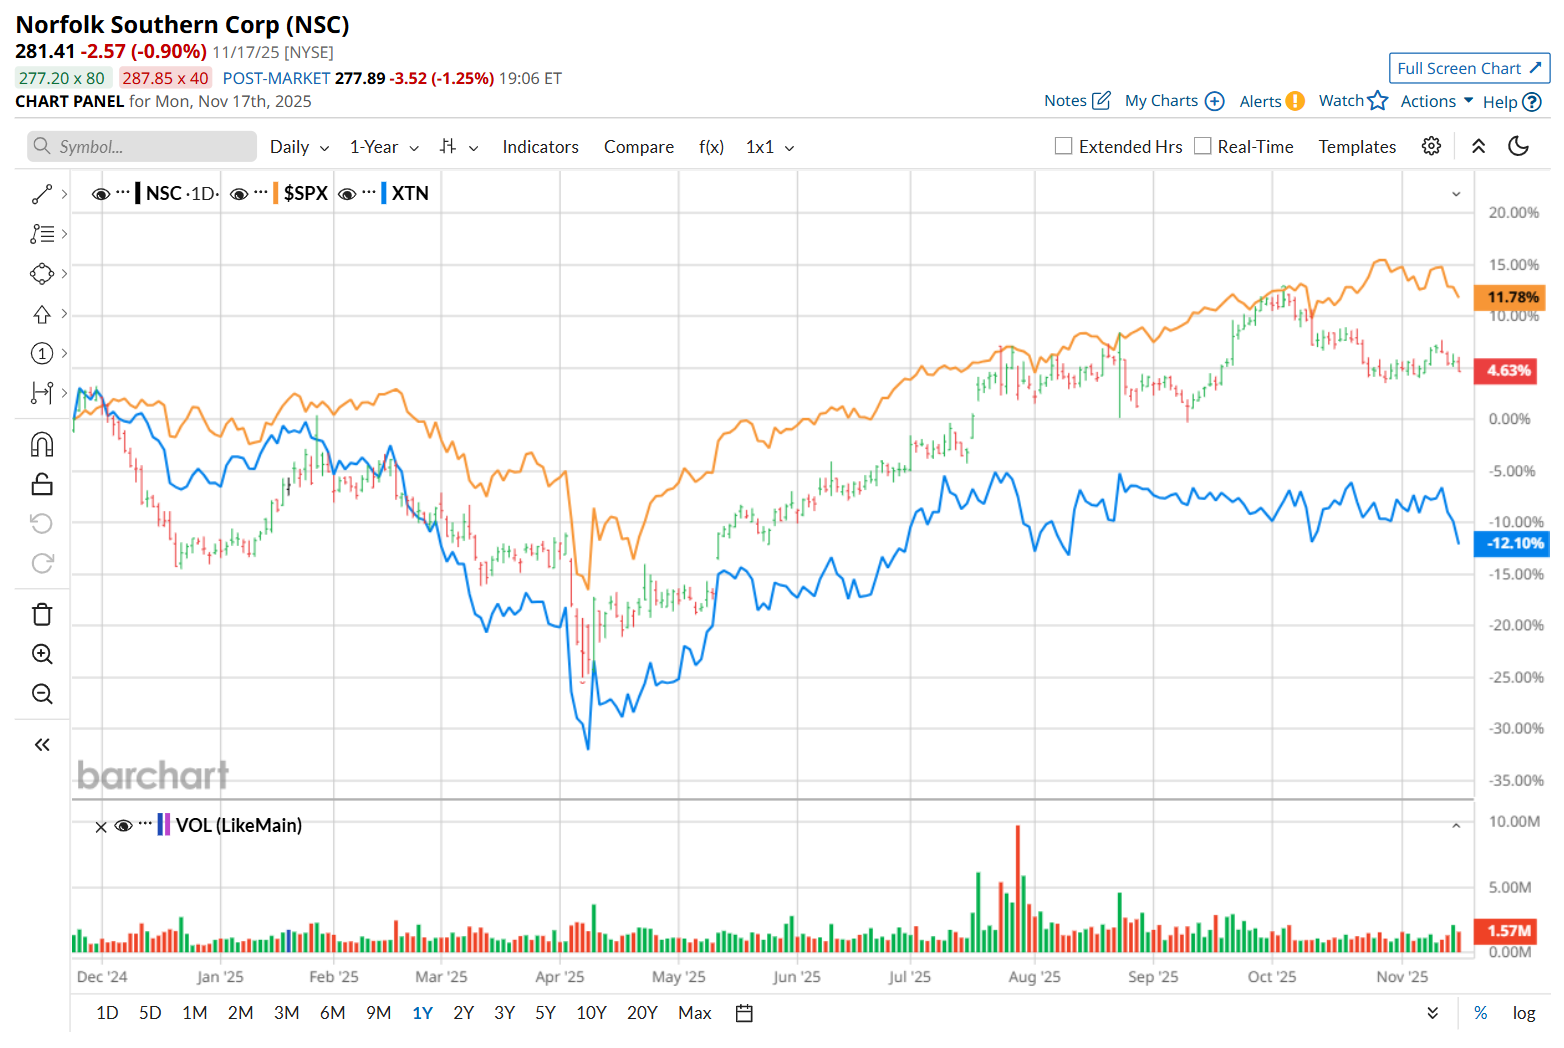
Shares of this railroad company have lagged behind the broader market over the past 52 weeks. NSC has gained 7.7% over this time frame, while the broader S&P 500 Index ($SPX) has soared 13.7%. However, on a YTD basis, the stock is up 19.9%, outpacing SPX’s 13.4% return.
Zooming in further, NSC has also outperformed the SPDR S&P Transportation ETF (XTN), which has declined 11.4% over the past 52 weeks and 6.3% on a YTD basis.
On Oct. 23, NSC released better-than-expected Q3 results, yet its shares plunged 1.2% in the following trading session. Both the company’s revenue of $3.1 billion and adjusted EPS of $3.30 came in ahead of analyst expectations. Moreover, its top line advanced 1.7%, while its bottom line grew 1.5% from the year-ago quarter. However, management noted that the volume surge anticipated by its partners failed to materialize, and an oversupplied truck market created additional pressure, suggesting that external factors weighed on the company’s performance despite internal progress. Additionally, it anticipates further volume pressure, particularly in its Intermodal segment, adding to investor concerns.
For the current fiscal year, ending in December, analysts expect NSC’s EPS to grow 4% year over year to $12.32. The company’s earnings surprise history is mixed. It exceeded the consensus estimates in three of the last four quarters, while missing on another occasion.
Among the 21 analysts covering the stock, the consensus rating is a "Moderate Buy,” which is based on six “Strong Buy” and 15 "Hold” ratings.
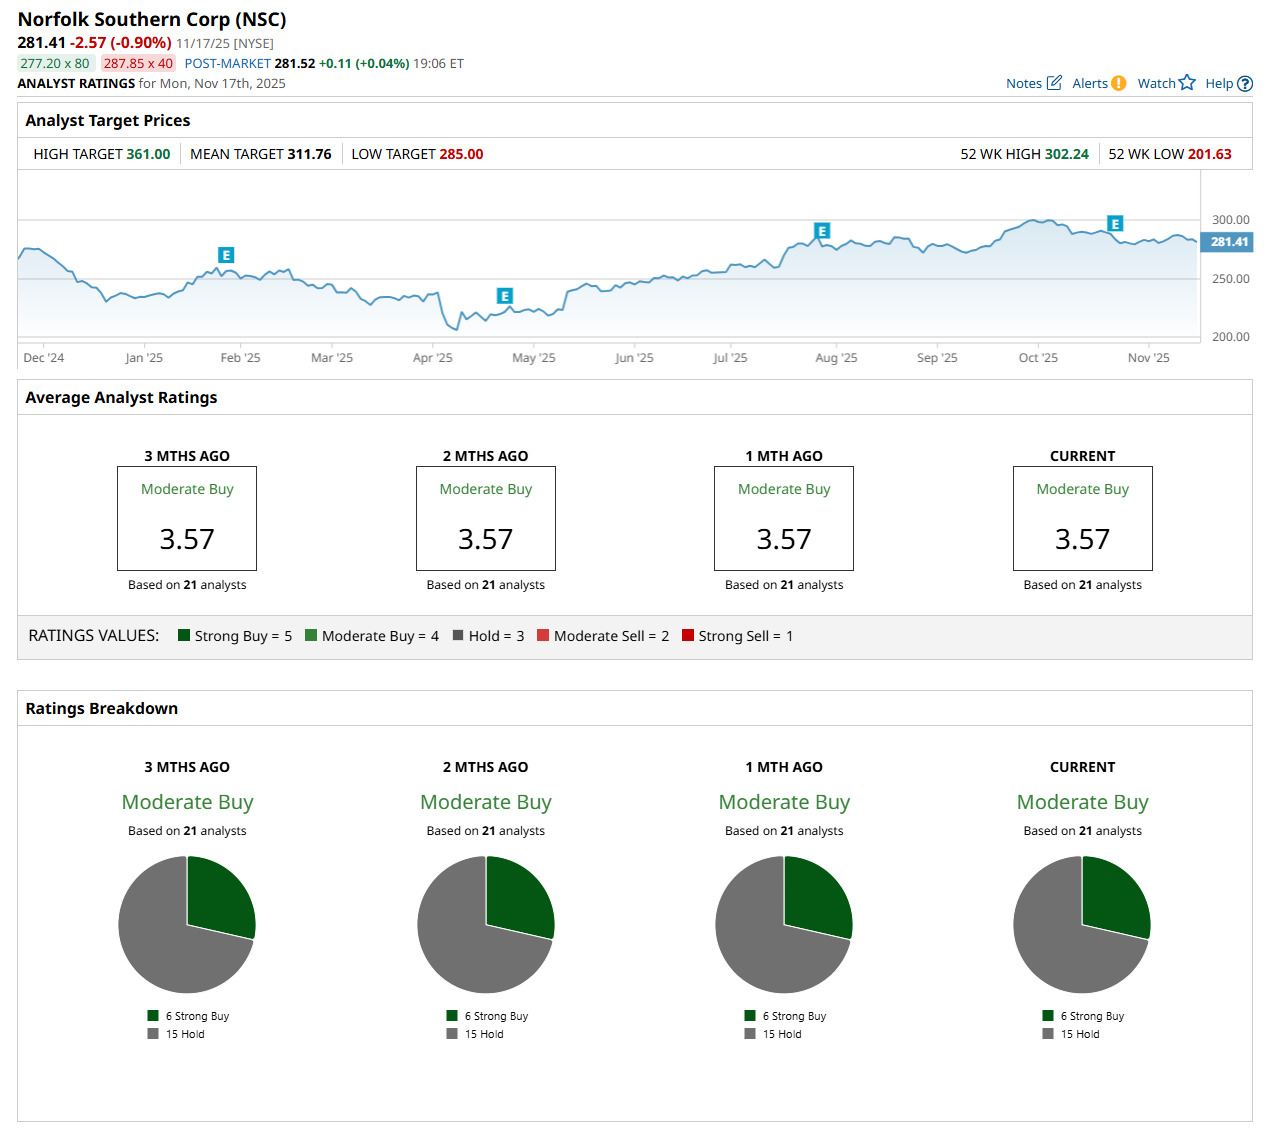
The configuration has remained consistent over the past three months.
On Nov. 11, AllianceBernstein Holding L.P. (AB) maintained an "Outperform" rating on NSC but lowered its price target to $333, indicating an 18.3% potential upside from the current levels.
The mean price target of $311.76 represents a 10.8% premium from NSC’s current price levels, while the Street-high price target of $361 suggests an ambitious 28.3% potential upside from the current levels.
On the date of publication, Neharika Jain did not have (either directly or indirectly) positions in any of the securities mentioned in this article. All information and data in this article is solely for informational purposes. For more information please view the Barchart Disclosure Policy here.
More news from Barchart
- Think AI Stocks Are Overvalued? Invest in These Data Center Power Trades for the Next Growth Phase.
- This High-Yield Dividend Stock Is Beaten Down, But Wall Street Still Loves It
- Unusual Options Activity Shows 71,000 Calls Hit the Tape for Applied Digital Stock – How You Should Play APLD Here
- AMD Is Powering the New Steam Machine. Will It Move the Needle for AMD Stock?


