I highlighted the price weakness in my October 21 Q3 Barchart report on the grain sector, concluding with:
At the current levels, prices have limited downside potential, while the upside could be substantial. I favor long positions in the sector, leaving plenty of room to add on further declines over the coming months. The 2026 crop year and supply uncertainty are just around the corner in early 2026, which could ignite price recoveries.
Don’t Miss a Day: From crude oil to coffee, sign up free for Barchart’s best-in-class commodity analysis.
Nearby CBOT corn futures prices moved 1.19% lower in Q5, and were 9.38% lower over the first nine months of 2025, settling at $4.155 per bushel on September 30. The price was higher in late November, and corn has been in a tepid bullish trend since mid-August 2025.
A corn rally since the mid-August 2025 lows
Nearby December 2025 CBOT corn futures have made higher lows and higher highs since reaching a low of $3.92 per bushel on August 12, 2025.
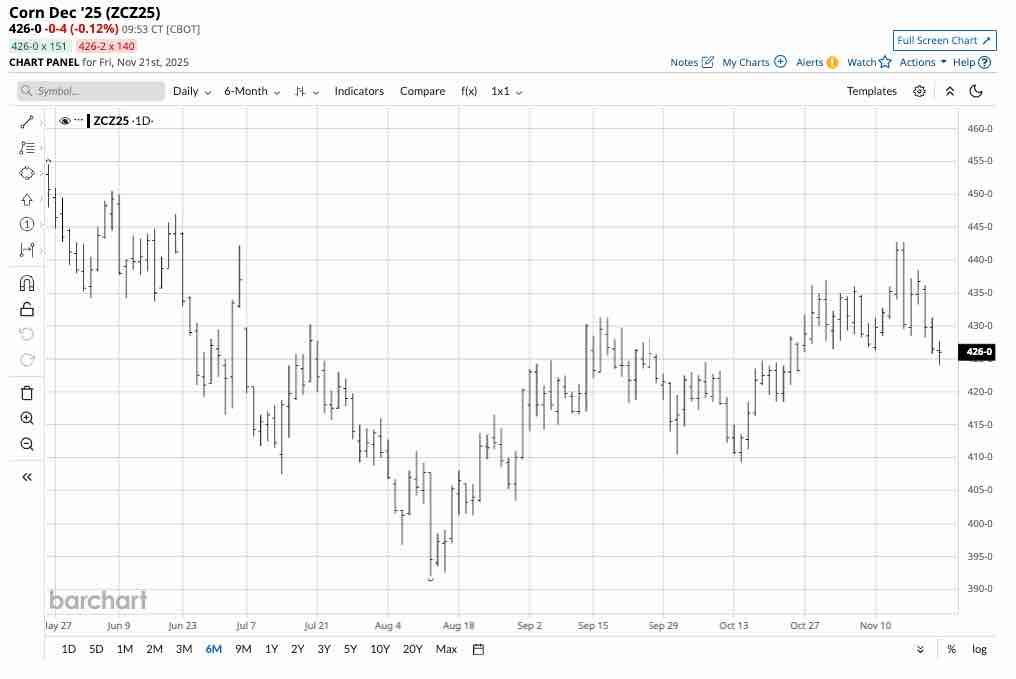
The daily chart highlights that corn futures rallied 12.95% from the mid-August low to the latest November 13 and 14 highs of $4.4275 per bushel.
The corn futures market remains in a long-term bearish trend since the 2022 high
While corn futures’ short-term path of least resistance is bullish, the long-term trend since 2022 remains bearish.
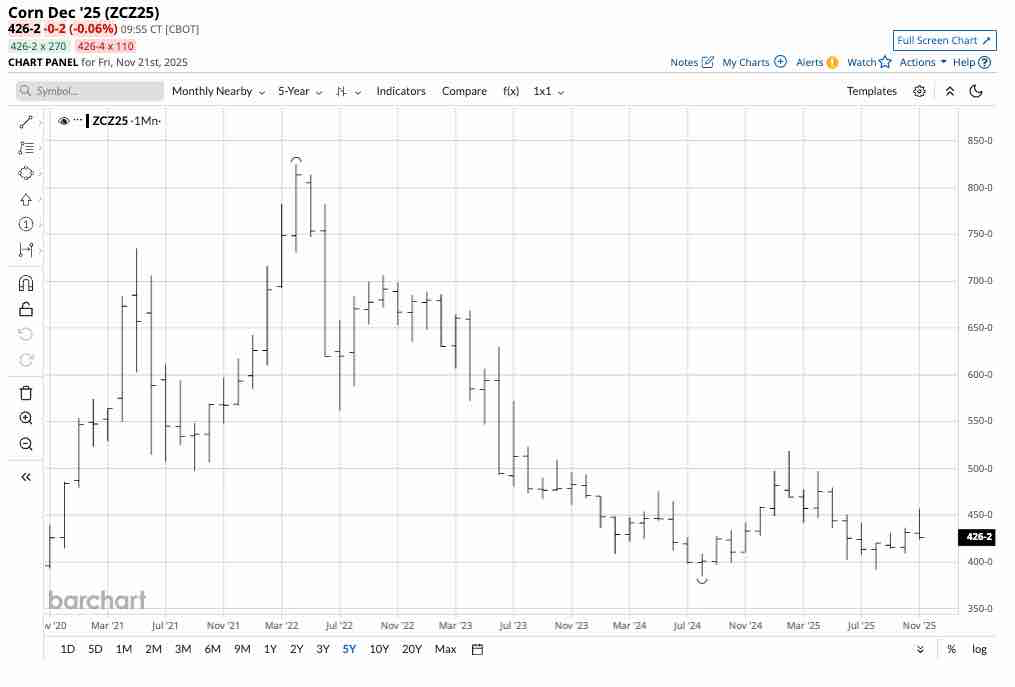
The five-year monthly chart illustrates the bearish pattern since the 2022 high of $8.245, the highest price since the 2012 peak of $8.49 per bushel. Ending the bearish long-term trend depends on corn futures rising above critical technical resistance at the February 2025 high of $5.1875 per bushel.
Commodity cyclicality could be critical in 2026
Commodity cyclicality is a core concept for the asset class. During bull markets, prices tend to increase to levels where production rises, inventories accumulate, and consumers find substitutes or limit purchases, leading to price tops and downside reversals. When corn futures reached their highest price since 2012 in 2022, the bullish trend lost its upside momentum due to cyclical factors.
Over the past few years, corn prices have declined to levels where production likely slowed as inflation caused production costs to erode producer margins. At low levels, inventories decline and consumers increase purchases, leading to price bottoms. Time will tell if the August 2024 low of $3.85 and the August 2025 higher low of $3.92 per bushel mark significant price bottoms in the corn market.
The weather is critical, but biofuel demand is rising
Weather conditions in the leading growing regions are the primary factor determining the path of least resistance for agricultural commodity prices, and corn is no exception.

As the chart shows, the United States is the world’s leading corn-producing country, followed by China, Brazil, and Argentina. The U.S. produces more than three times as much as third-place Brazil. Therefore, the weather conditions across the U.S.’s fertile plains during the 2026 crop year will ultimately determine if corn prices can eclipse the critical technical resistance level at $5.1875 per bushel.
Meanwhile, corn is the primary ingredient in U.S.-produced ethanol, a gasoline additive mandated by law.
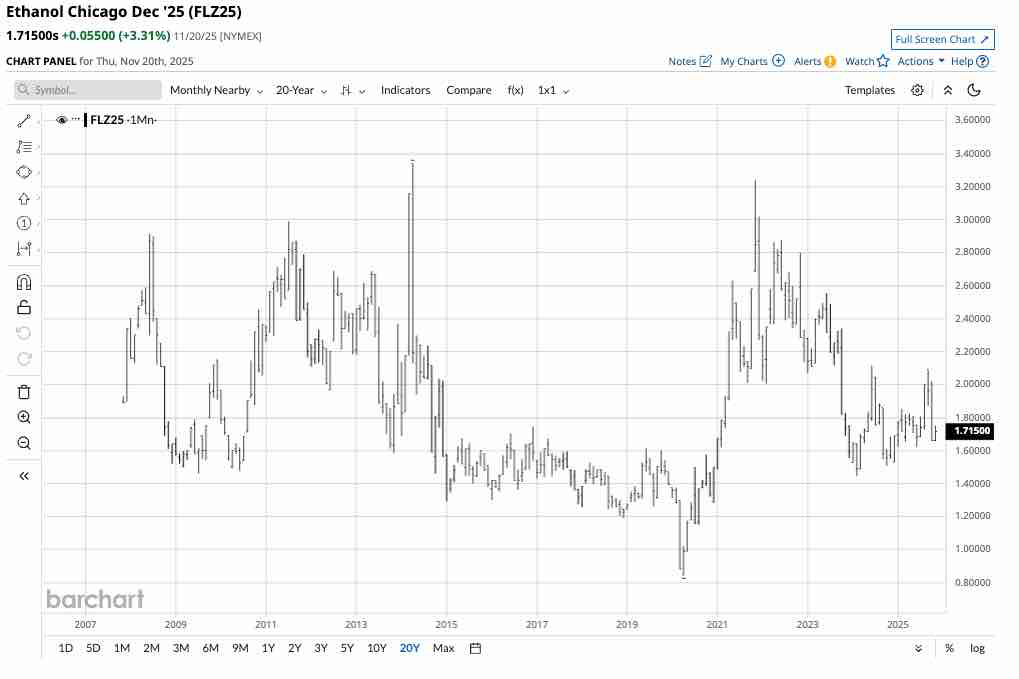
The monthly chart of Chicago ethanol swaps highlights the price increase since the April 2020 low and the volatility of biofuel prices. A rise in ethanol demand and prices will put upward pressure on corn prices.
CORN is the ETF that tracks a portfolio of CBOT corn futures
The most direct route for a risk position in corn is through the CBOT’s futures and futures options. Each corn futures contract contains 5,000 bushels. At $4.26 per bushel, the contract value is $21,300. The exchange’s original margin requirement is currently $1,072 per contract or 5.03% of the total value. If the equity on a long or short position declines below $975 per contract, the exchange requires maintenance margin payments.
Futures are leveraged financial instruments. The Teucrium Corn ETF (CORN) holds a portfolio of three actively trading CBOT corn futures contracts, excluding the nearby contract to mitigate roll risks. At $17.60 per share, CORN had over $47.8 million in assets under management. CORN trades an average of 64,460 contracts daily. According to the Teucrium website, CORN charges a 0.94% management fee.
The continuous corn futures rallied 12.95% from the August 2025 low to the November high.
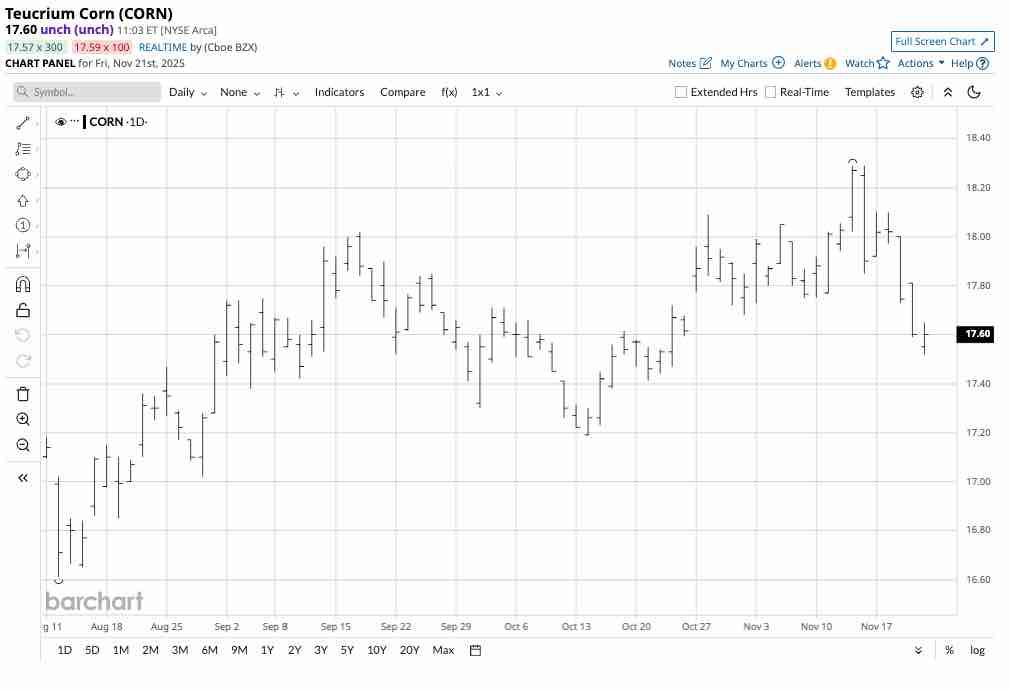
The chart shows that over the same period, the CORN ETF moved 10.11% higher from $16.61 to $18.29 per share. CORN tends to underperform the nearby CBOT corn futures contract on the upside and outperform when the price falls, as the most speculative activity occurs in the nearby futures contract, which the ETF excludes to lower roll risks. However, CORN does an excellent job tracking corn prices in the deferred contracts it holds.
Commodity cyclicality suggests higher corn prices as inflation has increased production costs, and the bearish trend has likely prompted producers to limit output. However, the weather conditions in the U.S. and other leading growing regions during the 2026 crop year will determine if corn prices can move above the critical resistance level, ending the bearish trend since the high in 2022.
Corn’s current rally has been tepid, but the prospects are for higher prices in 2026. The USDA’s latest November WASDE report was positive for corn prices as it reported that global corn stocks were slightly lower, tightening the global corn balance sheet. The USDA increased its corn price forecast. However, the weather during the 2026 crop year will ultimately determine how high prices can rise.
On the date of publication, Andrew Hecht did not have (either directly or indirectly) positions in any of the securities mentioned in this article. All information and data in this article is solely for informational purposes. For more information please view the Barchart Disclosure Policy here.
More news from Barchart


