With a market cap of $107 billion, ConocoPhillips (COP) is one of the world’s largest independent exploration and production (E&P) companies, focused on the discovery, development, and production of crude oil, natural gas, and natural gas liquids. Headquartered in Houston, Texas, the company operates across major energy regions, including the U.S. (notably the Permian Basin, Eagle Ford, and Bakken), Canada, the North Sea, Asia-Pacific, and the Middle East.
Companies valued at more than $10 billion are generally considered “large-cap” stocks, and ConocoPhillips fits this criterion perfectly. Unlike integrated oil giants that also manage refining and retail operations, ConocoPhillips is purely upstream, concentrating on resource extraction and efficiency in production. The company emphasizes strong capital discipline, low break-even costs, and shareholder returns through dividends and share buybacks. Its performance is closely tied to global commodity prices, energy demand trends, and geopolitical conditions within key resource markets.
However, shares of ConocoPhillips have dipped 20.1% from its 52-week high of $108.99. Over the past three months, the stock has risen 10.3%, which outpaced the SPDR S&P Oil & Gas Exploration & Production ETF’s (XOP) 1.7% return during the same period.

Over the long term, ConocoPhillips has declined 12.2% year-to-date, underperforming XOP's marginal loss. Over the past 52 weeks, COP shares have fallen 18.4%, compared with XOP’s 9.2% decline.
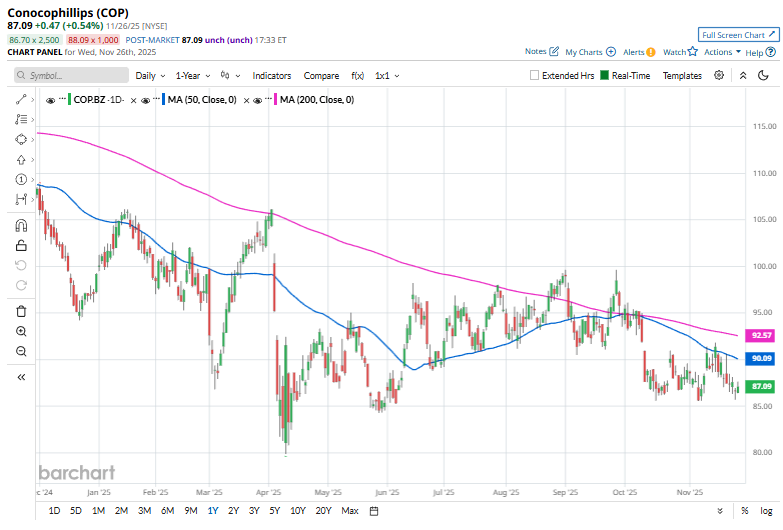
Since early October, the stock has traded mainly below both its 50-day and 200-day moving averages, signaling a sustained downtrend.
On Nov. 21, ConocoPhillips declined over 1% as WTI crude oil fell more than 2% to a four-week low, pressuring shares across the sector. The pullback reflects investor concerns about near-term energy demand and market volatility, putting pressure on upstream producers like ConocoPhillips, whose performance is closely tied to crude price movements.
In comparison, COP stock has lagged behind The Williams Companies, Inc. (WMB). WMB stock has risen 3.2% over the past 52 weeks and 11.3% on a YTD basis.
Despite the stock’s weak performance over the past year, analysts are bullish about its prospects. COP stock has a consensus rating of “Strong Buy” from the 27 analysts covering the stock, and the mean price target of $112.88 represents a premium of 29.6% to current levels.
On the date of publication, Kritika Sarmah did not have (either directly or indirectly) positions in any of the securities mentioned in this article. All information and data in this article is solely for informational purposes. For more information please view the Barchart Disclosure Policy here.
More news from Barchart
- With a 6.7% Yield and 27 Years of Dividend Hikes, Is This Stock a Buy Today?
- Marvell Stock Is Down 25% in 2025, and This Analyst Says Investors Should Stay Away from the MRVL Dip
- These Stock Charts Filter Out the Noise So You Can Focus on Price. Here’s What Trend Traders Need to Know.
- Cathie Wood Is Buying the Dip in BitMine Immersion Stock. Should You?


