Duke Energy Corporation (DUK), based in Charlotte, N.C., stands among the largest energy holding companies in the U.S. Its electric utilities power the lives of about 8.2 million customers across the Carolinas, Florida, Indiana, Ohio and Kentucky, supported by more than 50,000 megawatts of generation capacity. The company also delivers natural gas to roughly 1.6 million customers in North Carolina, South Carolina, Tennessee, Ohio and Kentucky, highlighting its broad role in keeping communities running every day.
With a market capitalization hovering around $96 billion, Duke Energy is firmly planted in “large-cap” territory, far above the $10 billion benchmark. The company’s size reinforces its substantial presence and influence across the U.S. utility landscape. But even with its scale and reach, Duke Energy hasn’t been keeping pace with its peers.
Over the past three months, shares of this utility company have barely budged, lagging behind its broader sector. The Utilities Select Sector SPDR Fund (XLU) has enjoyed a much stronger 5.6% lift over the same period. After hitting a 52-week peak of $130.03 in October, shares of DUK have pulled back roughly 5.1% from that level.
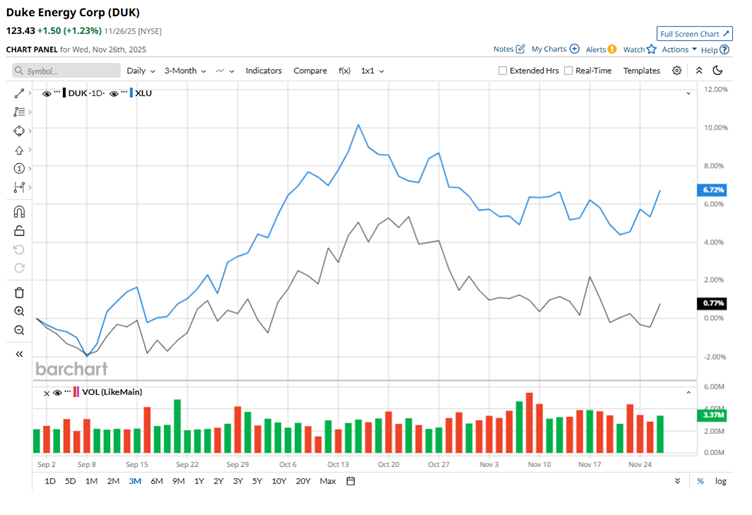
The picture doesn’t improve much when we zoom out either. Over the past year, Duke Energy’s stock has climbed around 5.5%, and so far in 2025, it’s up about 14.6%. Meanwhile, the broader utilities sector has outpaced these gains, rising roughly 8.6% over the past year and nearly 18.9% in 2025.
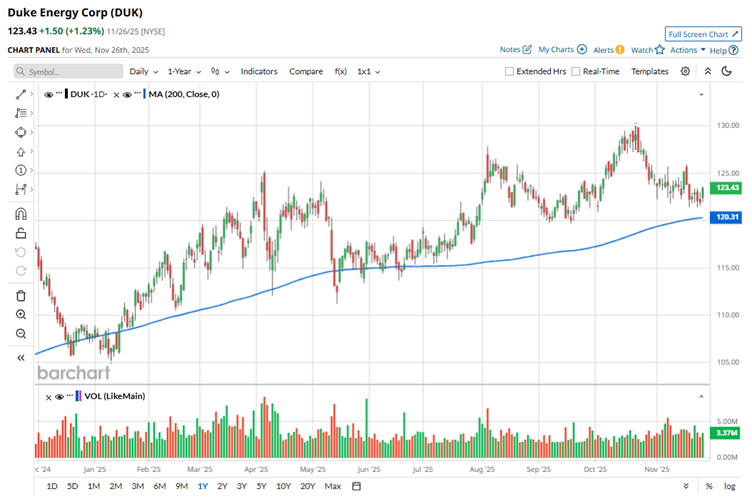
Duke Energy’s technical setup offers a brighter note. The stock has held firmly above its 200-day moving average since mid-May, a bullish sign that momentum has stayed intact, even as performance trails the broader sector.
Duke Energy has the scale of a powerhouse, yet its stock has spent too much time in the slow lane. While the company continues making heavy long-term investments in grid upgrades and clean-energy infrastructure that promise future returns, the near-term payoff remains modest, making many investors hesitant today. In its Q3 report released on Nov. 7, Duke delivered encouraging numbers. Total operating revenue rose to $8.5 billion, up 4.8% year over year, while EPS climbed 15.3% to $1.81.
Despite headwinds from rising interest expenses, softer weather, and higher depreciation and property taxes tied to a growing asset base, its fundamentals held up well. Looking ahead, management plans to unveil a bold $95–$105 billion capital program for 2026–2030 in February 2026, a massive bet on future growth, intended to boost infrastructure while keeping customer rates below the national average and delivering long-term value to its customers.
While Duke’s shares have struggled to keep up, its peer company, American Electric Power Company (AEP), has been racing ahead. AEP has soared about 23.6% over the past year and an impressive 33.1% so far in 2025, handily outperforming both Duke and the broader utilities sector.
Even though Duke’s relative stock performance has been disappointing, Wall Street isn’t ready to write it off. The consensus rating from 24 analysts is a “Moderate Buy”, and with the average price target sitting at $137.37, the stock still carries about 11.3% potential upside from current levels.
On the date of publication, Anushka Mukherjee did not have (either directly or indirectly) positions in any of the securities mentioned in this article. All information and data in this article is solely for informational purposes. For more information please view the Barchart Disclosure Policy here.
More news from Barchart


