Atlanta, Georgia-based Southern Company (SO) engages in the generation, transmission, and distribution of electricity. With a market cap of $99.4 billion, Southern operates as one of the largest utility companies in the U.S. and serves millions of customers in Mississippi, Alabama, Georgia, Tennessee, Virginia, and other states.
Companies worth $10 billion or more are generally referred to as “large-cap stocks.” Southern fits right into that category. Given the company’s extensive operations and influence and dominance in the utilities space, its valuation above this mark is unsurprising.
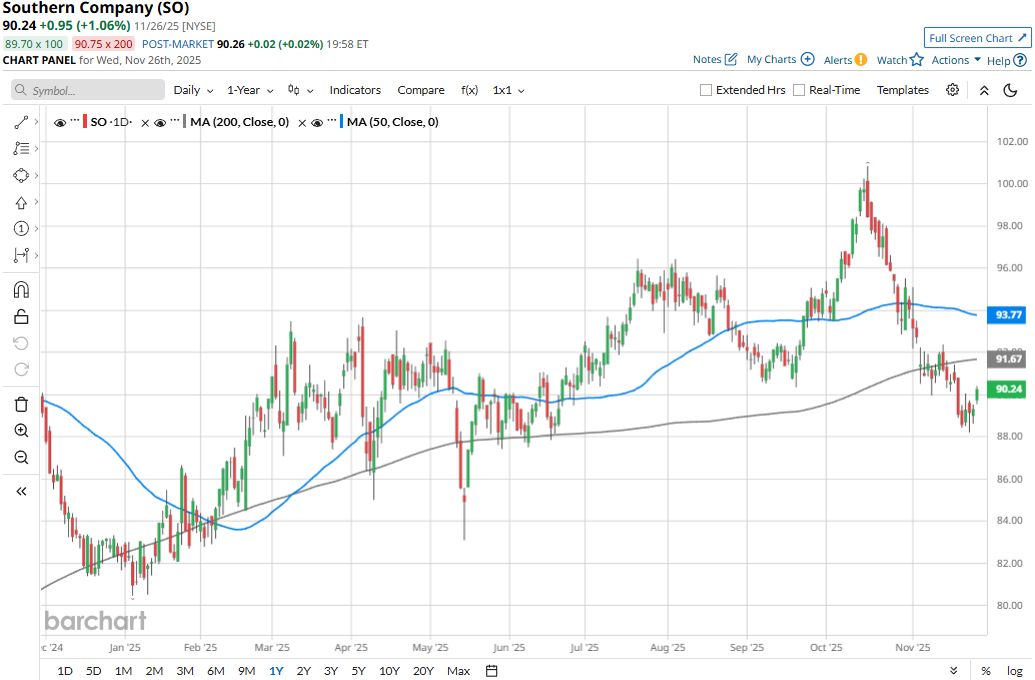
Southern touched its all-time high of $100.83 on Oct. 16, and is currently trading 10.5% below that peak. Meanwhile, SO stock prices have declined 3.1% over the past three months, lagging behind the Utilities Select Sector SPDR Fund’s (XLU) 5.6% gains during the same time frame.
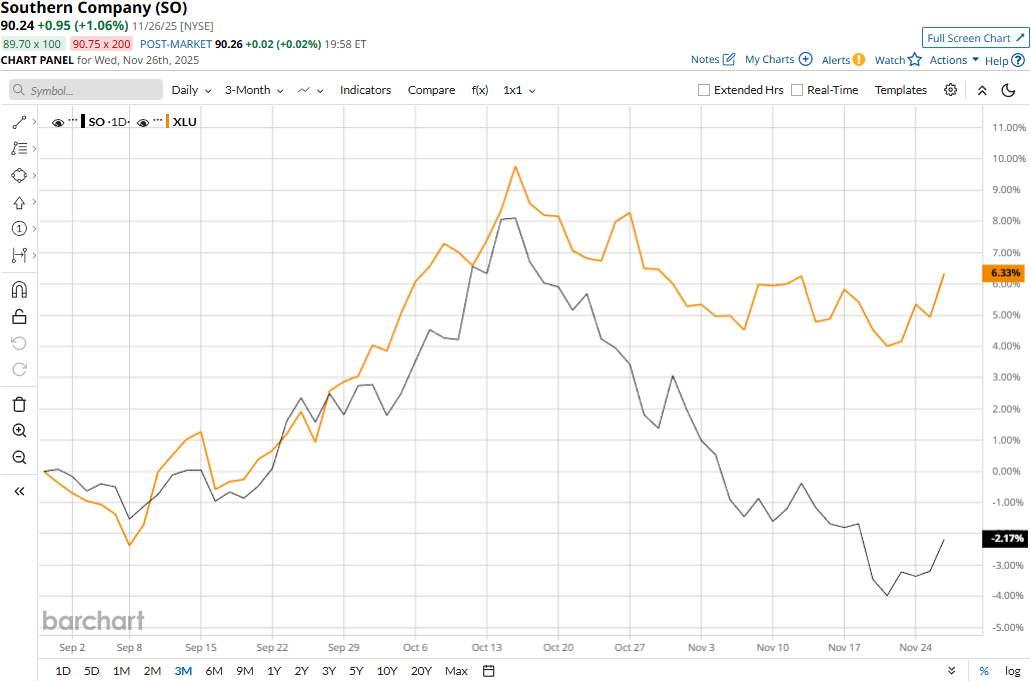
Southern has underperformed the broader utilities space over the longer term as well. SO stock prices have gained 9.6% in 2025 and observed 1% uptick over the past 52 weeks, compared to XLU’s 18.9% surge on a YTD basis and 8.6% returns over the past year.
Southern dropped below its 50-day moving average in late October and below its 200-day moving average in early November, underscoring its recent downturn.
Southern’s stock prices gained 1.7% in the trading session following the release of its better-than-expected Q3 results on Oct. 30. Driven by notable growth in fuel and non-fuel, retail and wholesale electric revenues, natural gas revenues, and other revenues, the company’s overall topline grew 7.5% year-over-year to $7.8 billion, beating the Street’s expectations by 3.8%. Further, its adjusted EPS surged 11.9% year-over-year to $1.60, surpassing the consensus estimates by a notable 6.7%.
However, Southern has also underperformed compared to its peer NextEra Energy, Inc.’s (NEE) 19.3% surge in 2025 and 10.4% gains over the past 52 weeks.
Among the 24 analysts covering Southern stock, the consensus rating is a “Hold.” As of writing, its mean price target of $100.83 suggests an 11.7% upside potential from current price levels.
On the date of publication, Aditya Sarawgi did not have (either directly or indirectly) positions in any of the securities mentioned in this article. All information and data in this article is solely for informational purposes. For more information please view the Barchart Disclosure Policy here.
More news from Barchart
- This AI Dividend Stock Is a Buy Even as the S&P 500’s Yield Falls to Dot-Com Lows
- Have You Heard of the ‘Wheel’ Strategy? These 3 Unusually Active Stocks to Buy Can Get You Started
- 3 Buy-Rated Dividend Aristocrats Easily Beating Inflation
- ‘Insatiable’ Demand Is Powering This ‘Picks and Shovels’ AI Stock up 245%. Should You Buy It Here?


