Sunnyvale, California-based Synopsys, Inc. (SNPS) is a leader in electronic design automation (EDA) software, semiconductor intellectual property (IP), and silicon-to-systems solutions. Valued at a market cap of $76.1 billion, the company’s tools enable engineers to create complex integrated circuits and system-on-chips for applications spanning AI, automotive, cloud computing, mobile, and high-performance computing.
Companies valued at $10 billion or more are typically classified as “large-cap stocks,” and SNPS fits the label perfectly, with its market cap exceeding this threshold, underscoring its size, influence, and dominance within the software - infrastructure industry. With growing demand for smaller, faster, and more energy-efficient chips, the company benefits from long-term structural tailwinds in the semiconductor industry, supported by deep customer relationships, a subscription-based business model, and continued investment in R&D.
Despite its notable strength, this tech company has slipped 37.1% from its 52-week high of $651.73, reached on Jul. 30. Shares of Synopsys have declined 31.1% over the past three months, considerably underperforming the Technology Select Sector SPDR Fund’s (XLK) 7.9% rise during the same time frame.
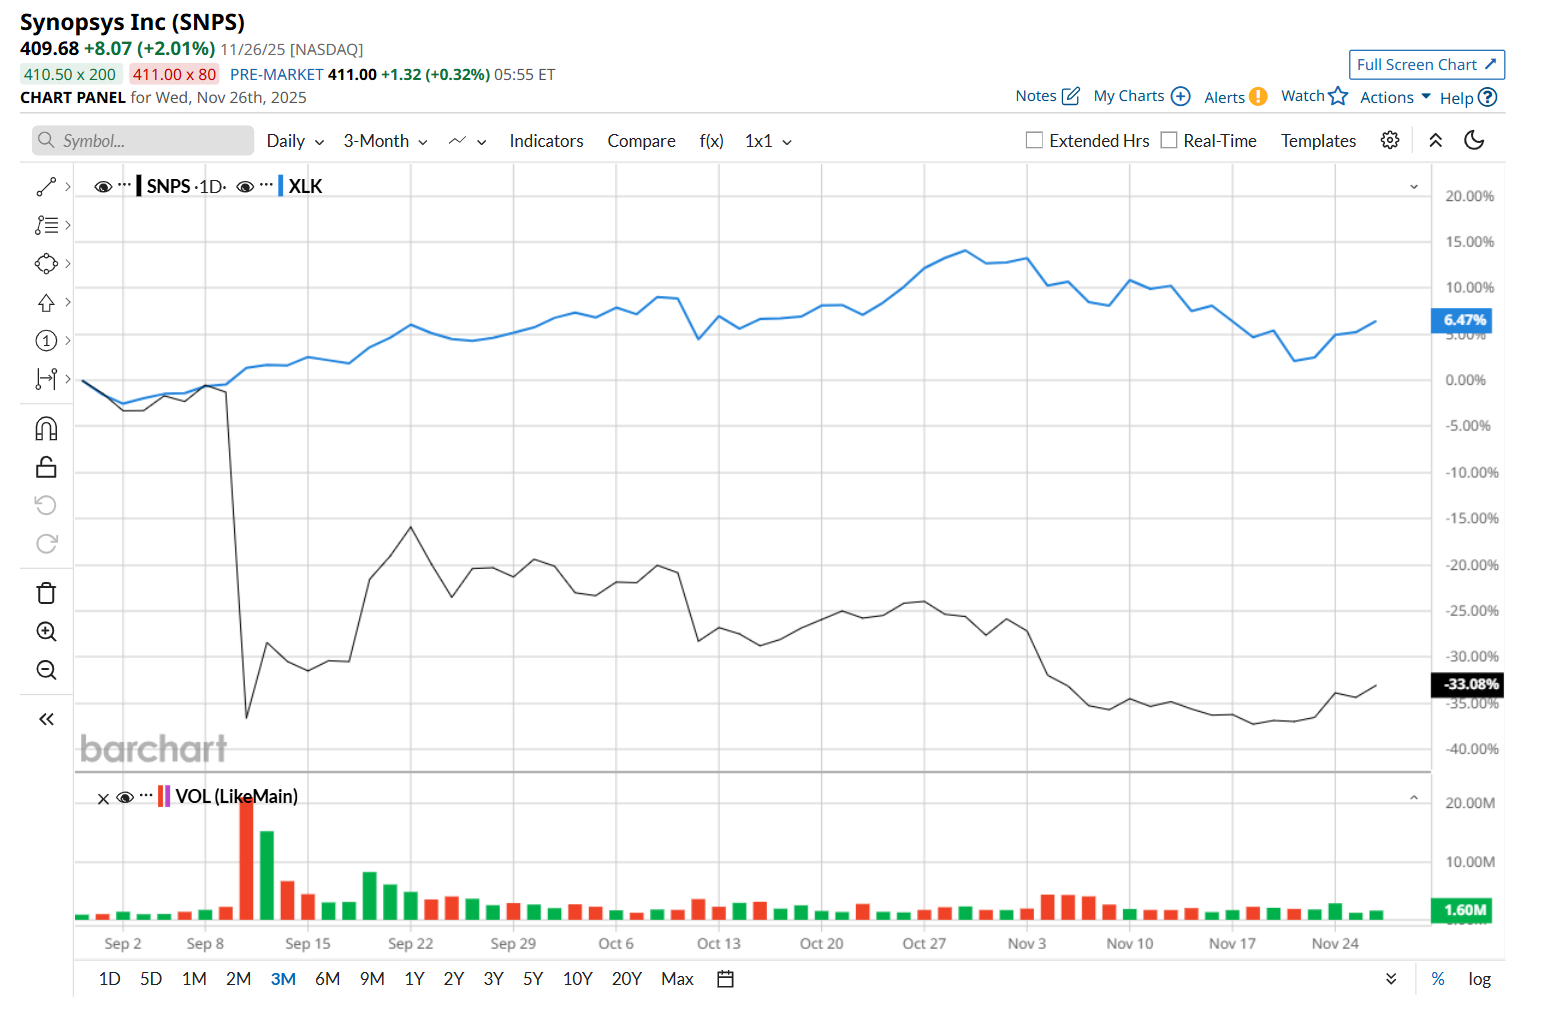
In the longer term, SNPS has fallen 26% over the past 52 weeks, notably lagging behind XLK's 20.9% uptick over the same time period. Moreover, on a YTD basis, shares of SNPS are down 15.6%, compared to XLK’s 22.1% return.
To confirm its bearish trend, SNPS has been trading below its 200-day and 50-day moving averages since early September.
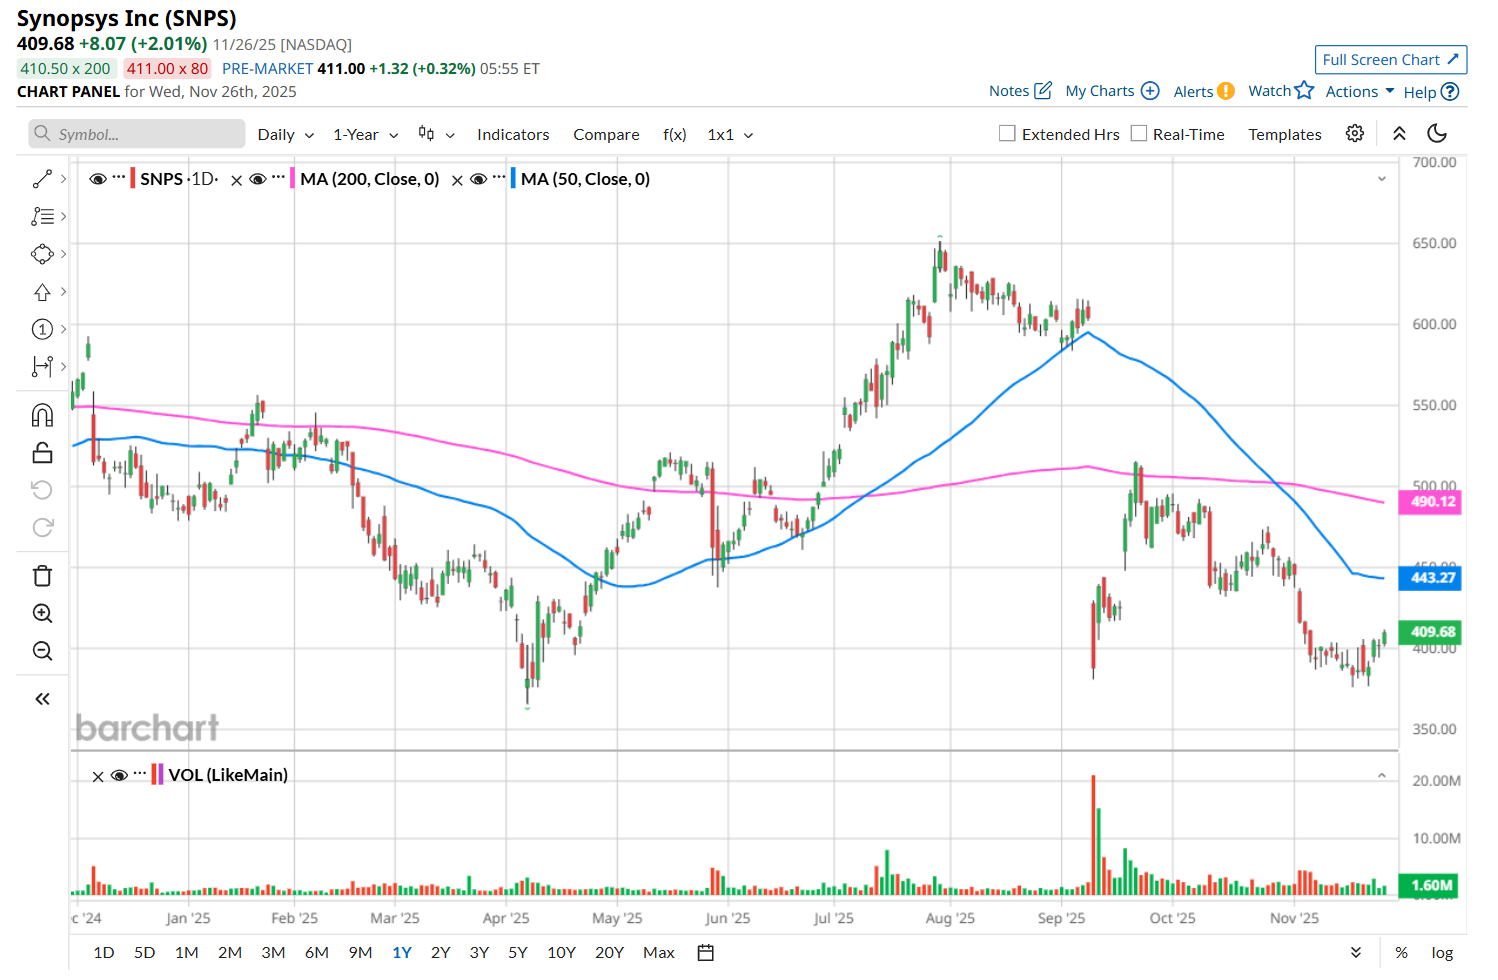
On Sep. 9, SNPS reported weaker-than-expected Q3 results, leading to a 35.8% fall in its share price in the following trading session. The company’s total revenue improved 14% year-over-year to $1.7 billion, but missed analyst expectations by 1.7%. Meanwhile, its adjusted EPS of $3.39 declined 1.2% from the year-ago quarter and fell 11.7% short of Wall Street estimates.
SNPS has also notably underperformed its rival, Cadence Design Systems, Inc.’s (CDNS) 1.2% drop over the past 52 weeks and 2% rise on a YTD basis
Despite Synopsys’ recent underperformance, analysts remain moderately optimistic about its prospects. The stock has a consensus rating of "Moderate Buy” from the 21 analysts covering it, and the mean price target of $552.14 suggests a 34.8% premium to its current price levels.
On the date of publication, Neharika Jain did not have (either directly or indirectly) positions in any of the securities mentioned in this article. All information and data in this article is solely for informational purposes. For more information please view the Barchart Disclosure Policy here.
More news from Barchart
- Argus Just Slashed Its Earnings Estimates for Coinbase. Should You Dump COIN Stock Here?
- Big Money is Betting on Natural Gas Prices to Break Out. Here’s the Setup.
- Is This Under-the-Radar High-Yield AI Stock a Buy Now?
- Wall Street Likes Server Stocks After Nvidia’s Q3. Is DELL or HPE Stock a Better Buy Here?