ETFOptimize | High-performance ETF-based Investment Strategies

Quantitative strategies, Wall Street-caliber research, and insightful market analysis since 1998.


ETFOptimize | HOME
Close Window

Are Wall Street Analysts Predicting Eli Lilly Stock Will Climb or Sink?

Indianapolis, Indiana-based Eli Lilly and Company (LLY) discovers and develops various drugs and medicines. It operates as one of the largest pharmaceutical companies in the world and boasts a diverse portfolio of numerous successful drugs, including Mounjaro, Trulicity, Verzenio, and more. With a market cap of $816.7 billion, its operations span various countries in the Americas, EMEA, and the Indo-Pacific.

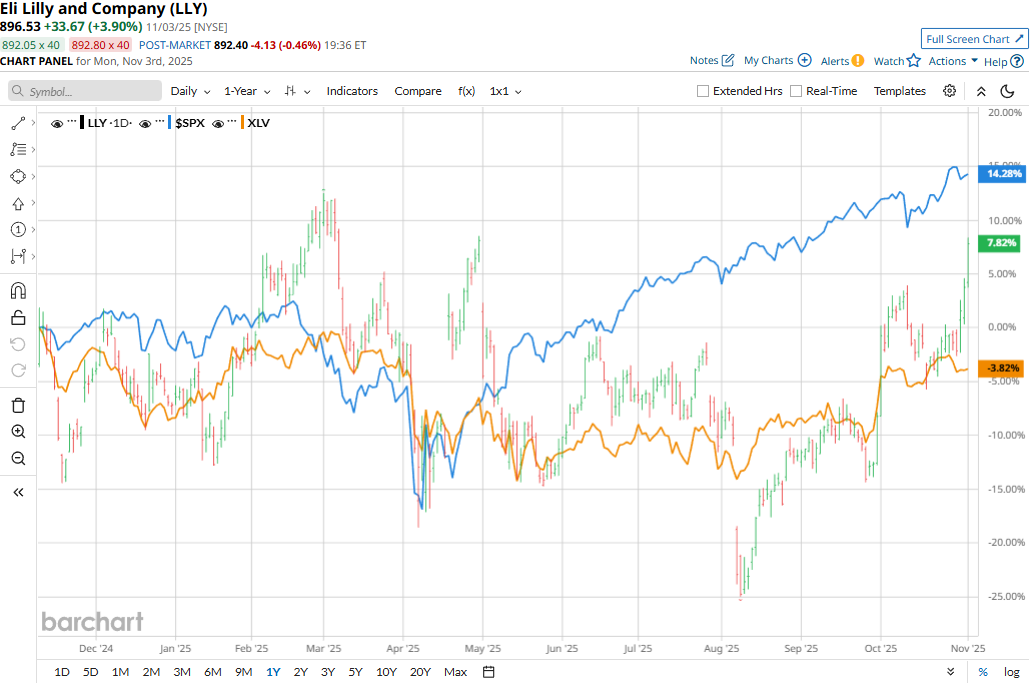
Despite its notable strengths, the pharma giant has lagged behind the broader market over the past year. LLY stock prices have gained 16.1% on a YTD basis and 9.5% over the past 52 weeks, compared to the S&P 500 Index’s ($SPX16.5% gains in 2025 and 19.6% returns over the past year.


Narrowing the focus, LLY outperformed the Health Care Select Sector SPDR Fund’s (XLV5% uptick in 2025 and 2.2% decline over the past year.

www.barchart.com

Eli Lilly’s stock prices gained 3.8% in the trading session following the release of its impressive Q3 results on Oct. 30. Driven by the solid volume growth in Mounjaro and Zepbound sales, the company’s topline for the quarter skyrocketed 53.9% year-over-year to $17.6 billion, beating the Street’s expectations by a massive 9.9%. Meanwhile, its adjusted EPS surged by a humongous 494.9% year-over-year to $7.02, surpassing the consensus estimates by 16.6%. Further, observing the trend, Eli Lilly raised its full-year revenues and EPS guidance, boosting investor confidence.

For the full fiscal 2025, ending in December, analysts expect LLY to deliver an adjusted EPS of $24.04, up 85.1% year-over-year. The company has a mixed earnings surprise history. While it missed the Street’s bottom-line estimates once over the past four quarters, it surpassed the projections on three other occasions.

Among the 27 analysts covering the LLY stock, the consensus rating is a “Strong Buy.” That’s based on 19 “Strong Buys,” two “Moderate Buys,” and six “Holds.”

www.barchart.com

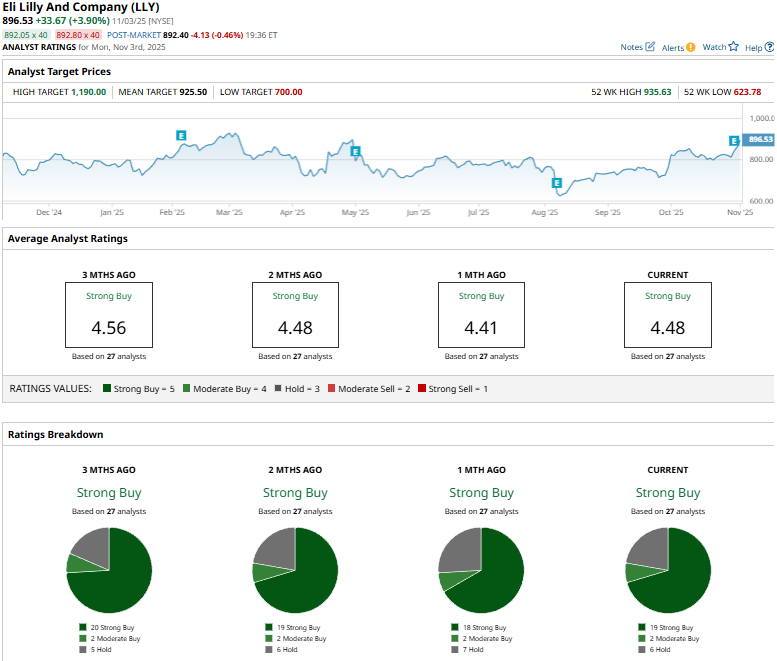
This configuration is slightly less optimistic than three months ago, when 20 analysts gave “Strong Buy” recommendations.

On Oct. 31, Cantor Fitzgerald analyst Carter Gould maintained an “Overweight” rating on LLY and raised the price target from $925 to $985.

LLY’s mean price target of $925.50 represents a modest premium of 3.2% from current price levels. Meanwhile, the street-high target of $1,190 suggests a notable potential upside of 32.7%.


On the date of publication, Aditya Sarawgi did not have (either directly or indirectly) positions in any of the securities mentioned in this article. All information and data in this article is solely for informational purposes. For more information please view the Barchart Disclosure Policy here.


More news from Barchart

Recent Quotes

View More
Symbol Price Change (%)
AMZN  198.79
-0.81 (-0.41%)
AAPL  255.78
-5.95 (-2.27%)
AMD  207.32
+1.38 (0.67%)
BAC  52.55
+0.03 (0.06%)
GOOG  306.02
-3.35 (-1.08%)
META  639.77
-10.04 (-1.55%)
MSFT  401.32
-0.52 (-0.13%)
NVDA  182.81
-4.13 (-2.21%)
ORCL  160.14
+3.66 (2.34%)
TSLA  417.44
+0.37 (0.09%)
Stock Quote API & Stock News API supplied by www.cloudquote.io
Quotes delayed at least 20 minutes.
By accessing this page, you agree to the Privacy Policy and Terms Of Service.


IntelligentValue Home
Close Window

DISCLAIMER

All content herein is issued solely for informational purposes and is not to be construed as an offer to sell or the solicitation of an offer to buy, nor should it be interpreted as a recommendation to buy, hold or sell (short or otherwise) any security.  All opinions, analyses, and information included herein are based on sources believed to be reliable, but no representation or warranty of any kind, expressed or implied, is made including but not limited to any representation or warranty concerning accuracy, completeness, correctness, timeliness or appropriateness. We undertake no obligation to update such opinions, analysis or information. You should independently verify all information contained on this website. Some information is based on analysis of past performance or hypothetical performance results, which have inherent limitations. We make no representation that any particular equity or strategy will or is likely to achieve profits or losses similar to those shown. Shareholders, employees, writers, contractors, and affiliates associated with ETFOptimize.com may have ownership positions in the securities that are mentioned. If you are not sure if ETFs, algorithmic investing, or a particular investment is right for you, you are urged to consult with a Registered Investment Advisor (RIA). Neither this website nor anyone associated with producing its content are Registered Investment Advisors, and no attempt is made herein to substitute for personalized, professional investment advice. Neither ETFOptimize.com, Global Alpha Investments, Inc., nor its employees, service providers, associates, or affiliates are responsible for any investment losses you may incur as a result of using the information provided herein. Remember that past investment returns may not be indicative of future returns.

Copyright © 1998-2017 ETFOptimize.com, a publication of Optimized Investments, Inc. All rights reserved.