ETFOptimize | High-performance ETF-based Investment Strategies

Quantitative strategies, Wall Street-caliber research, and insightful market analysis since 1998.


ETFOptimize | HOME
Close Window

Do Wall Street Analysts Like Mosaic Stock?

The Mosaic Company (MOS), headquartered in Tampa, Florida, manufactures and distributes concentrated phosphate and potash crop nutrients. Valued at $8.7 billion by market cap, the company owns and operates mines that produce key agricultural products like diammonium phosphate, monoammonium phosphate, and ammoniated phosphate, as well as manufactures phosphate-based animal feed additives under the Biofos and Nexfos brands.

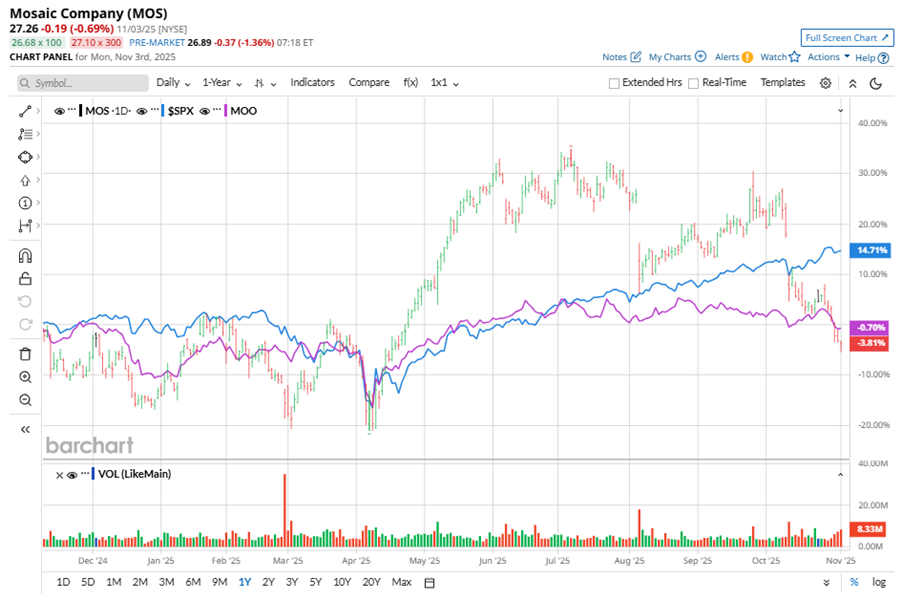
Shares of this leading producer of concentrated phosphate and potash have underperformed the broader market over the past year. MOS has gained 1.4% over this time frame, while the broader S&P 500 Index ($SPX) has rallied nearly 19.6%. In 2025, MOS stock is up 10.9%, compared to the SPX’s 16.5% rise on a YTD basis. 


Zooming in further, MOS’ underperformance is also apparent compared to VanEck Agribusiness ETF (MOO). The exchange-traded fund has declined marginally over the past year. However, MOS’ returns on a YTD basis slightly outshine the ETF’s 10.7% gains over the same time frame. 

www.barchart.com

On Aug. 5, MOS reported its Q2 results, and its shares closed down more than 13% in the following trading session. Its adjusted EPS of $0.51 missed Wall Street expectations of $0.67. The company’s revenue was $3 billion, falling short of Wall Street forecasts of $3.1 billion.

For the current fiscal year, ending in December, analysts expected MOS’ EPS to grow 48% to $2.93 on a diluted basis. The company’s earnings surprise history is disappointing. It missed the consensus estimates in three of the last four quarters while beating the forecast on another occasion.

Among the 17 analysts covering MOS stock, the consensus is a “Moderate Buy.” That’s based on nine “Strong Buy” ratings, and eight “Holds.”

www.barchart.com

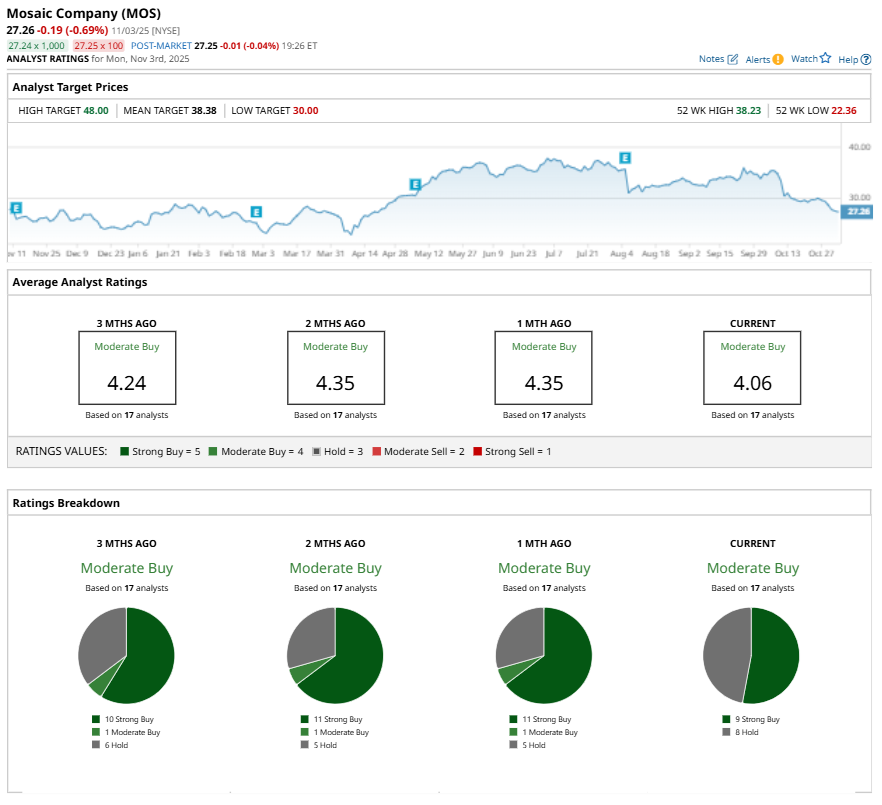
This configuration is less bullish than a month ago, with 11 analysts suggesting a “Strong Buy,” and one analyst recommending a “Moderate Buy.”

On Oct. 22, Oppenheimer Holdings Inc. (OPY) kept an “Outperform” rating on MOS and lowered the price target to $40, implying a potential upside of 46.7% from current levels.

The mean price target of $38.38 represents a 40.8% premium to MOS’ current price levels. The Street-high price target of $48 suggests an ambitious upside potential of 76.1%. 


On the date of publication, Neha Panjwani did not have (either directly or indirectly) positions in any of the securities mentioned in this article. All information and data in this article is solely for informational purposes. For more information please view the Barchart Disclosure Policy here.


More news from Barchart

Recent Quotes

View More
Symbol Price Change (%)
AMZN  220.69
+3.55 (1.63%)
AAPL  271.49
+5.24 (1.97%)
AMD  203.78
-2.24 (-1.09%)
BAC  51.56
+0.56 (1.10%)
GOOG  299.65
+9.67 (3.33%)
META  594.25
+5.10 (0.87%)
MSFT  472.12
-6.31 (-1.32%)
NVDA  178.88
-1.76 (-0.97%)
ORCL  198.76
-11.93 (-5.66%)
TSLA  391.09
-4.14 (-1.05%)
Stock Quote API & Stock News API supplied by www.cloudquote.io
Quotes delayed at least 20 minutes.
By accessing this page, you agree to the Privacy Policy and Terms Of Service.


IntelligentValue Home
Close Window

DISCLAIMER

All content herein is issued solely for informational purposes and is not to be construed as an offer to sell or the solicitation of an offer to buy, nor should it be interpreted as a recommendation to buy, hold or sell (short or otherwise) any security.  All opinions, analyses, and information included herein are based on sources believed to be reliable, but no representation or warranty of any kind, expressed or implied, is made including but not limited to any representation or warranty concerning accuracy, completeness, correctness, timeliness or appropriateness. We undertake no obligation to update such opinions, analysis or information. You should independently verify all information contained on this website. Some information is based on analysis of past performance or hypothetical performance results, which have inherent limitations. We make no representation that any particular equity or strategy will or is likely to achieve profits or losses similar to those shown. Shareholders, employees, writers, contractors, and affiliates associated with ETFOptimize.com may have ownership positions in the securities that are mentioned. If you are not sure if ETFs, algorithmic investing, or a particular investment is right for you, you are urged to consult with a Registered Investment Advisor (RIA). Neither this website nor anyone associated with producing its content are Registered Investment Advisors, and no attempt is made herein to substitute for personalized, professional investment advice. Neither ETFOptimize.com, Global Alpha Investments, Inc., nor its employees, service providers, associates, or affiliates are responsible for any investment losses you may incur as a result of using the information provided herein. Remember that past investment returns may not be indicative of future returns.

Copyright © 1998-2017 ETFOptimize.com, a publication of Optimized Investments, Inc. All rights reserved.