ETFOptimize | High-performance ETF-based Investment Strategies

Quantitative strategies, Wall Street-caliber research, and insightful market analysis since 1998.


ETFOptimize | HOME
Close Window

Is Wall Street Bullish or Bearish on Charles Schwab Stock?

The Charles Schwab Corporation (SCHW), headquartered in Westlake, Texas, operates as a savings and loan holding company. With a market cap of $171.6 billion, the company provides wealth and asset management, securities brokerage, banking, trading and research, custody, and financial advisory services.

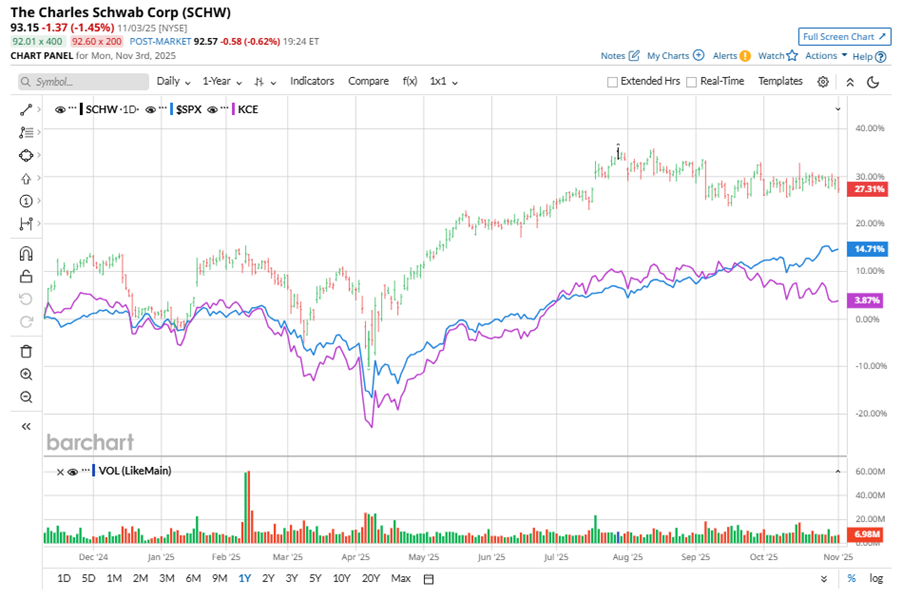
Shares of this leading financial services firm have outperformed the broader market over the past year. SCHW has gained 31.3% over this time frame, while the broader S&P 500 Index ($SPX) has rallied nearly 19.6%. In 2025, SCHW stock is up 25.9%, surpassing the SPX’s 16.5% rise on a YTD basis.


Zooming in further, SCHW’s outperformance is also apparent compared to the SPDR S&P Capital Markets ETF (KCE). The exchange-traded fund has gained about 10.9% over the past year. Moreover, SCHW’s double-digit returns on a YTD basis outshine the ETF’s 6.1% gains over the same time frame. 

www.barchart.com

Charles Schwab's strong Q3 performance was driven by robust client activity, asset gathering, and growth in brokerage and lending. The company added 1.1 million new brokerage accounts and $138 billion in net new assets, as clients deepened relationships and increased engagement across both digital and branch networks. Schwab is well-positioned for growth, with plans to introduce direct crypto trading in 2026 and a focus on expanding its RIA support ecosystem.

On Oct. 16, SCHW shares closed down by 1% after reporting its Q3 results. Its net revenues stood at $6.1 billion, up 26.6% year over year. The company’s adjusted EPS increased 70.1% from the year-ago quarter to $1.31. 

For the current fiscal year, ending in December, analysts expect SCHW’s EPS to grow 47.1% to $4.78 on a diluted basis. The company’s earnings surprise history is impressive. It beat the consensus estimate in each of the last four quarters.

Among the 23 analysts covering SCHW stock, the consensus is a “Moderate Buy.” That’s based on 13 “Strong Buy” ratings, four “Moderate Buys,” four “Holds,” one “Moderate Sell,” and one “Strong Sell.”

www.barchart.com

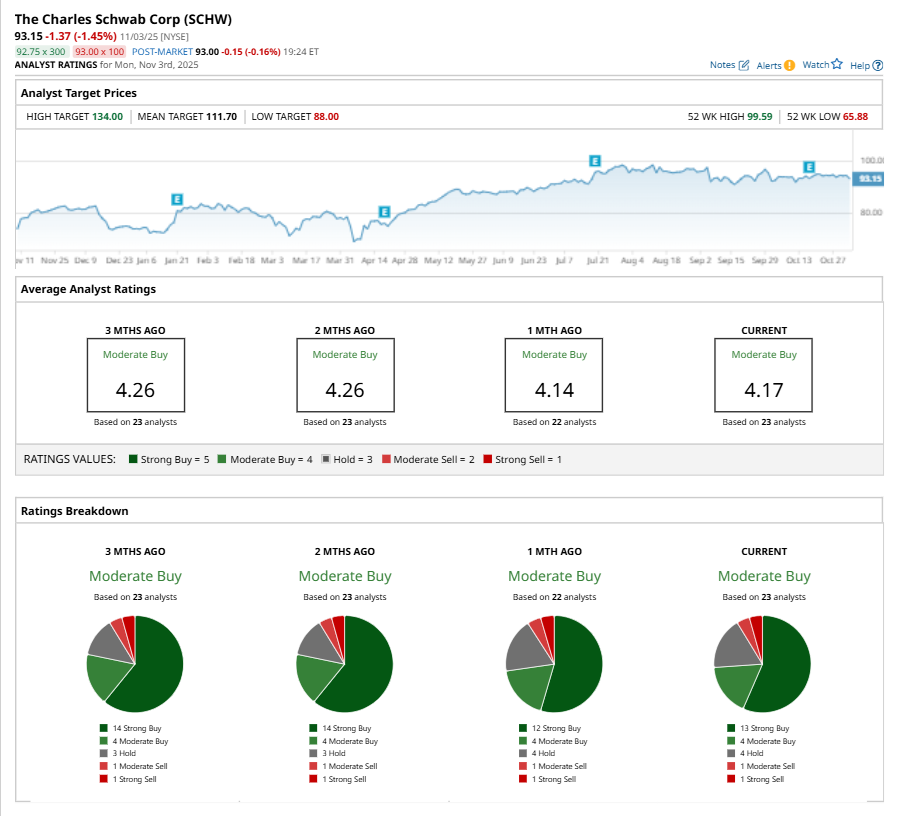
This configuration is more bullish than a month ago, with 12 analysts suggesting a “Strong Buy.”

On Oct. 20, JPMorgan Chase & Co. (JPM) kept an “Overweight” rating on SCHW and raised the price target to $121, implying a potential upside of 29.9% from current levels.

The mean price target of $111.70 represents a 19.9% premium to SCHW’s current price levels. The Street-high price target of $134 suggests an ambitious upside potential of 43.9%. 


On the date of publication, Neha Panjwani did not have (either directly or indirectly) positions in any of the securities mentioned in this article. All information and data in this article is solely for informational purposes. For more information please view the Barchart Disclosure Policy here.


More news from Barchart

Recent Quotes

View More
Symbol Price Change (%)
AMZN  220.69
+3.55 (1.63%)
AAPL  271.49
+5.24 (1.97%)
AMD  203.78
-2.24 (-1.09%)
BAC  51.56
+0.56 (1.10%)
GOOG  299.65
+9.67 (3.33%)
META  594.25
+5.10 (0.87%)
MSFT  472.12
-6.31 (-1.32%)
NVDA  178.88
-1.76 (-0.97%)
ORCL  198.76
-11.93 (-5.66%)
TSLA  391.09
-4.14 (-1.05%)
Stock Quote API & Stock News API supplied by www.cloudquote.io
Quotes delayed at least 20 minutes.
By accessing this page, you agree to the Privacy Policy and Terms Of Service.


IntelligentValue Home
Close Window

DISCLAIMER

All content herein is issued solely for informational purposes and is not to be construed as an offer to sell or the solicitation of an offer to buy, nor should it be interpreted as a recommendation to buy, hold or sell (short or otherwise) any security.  All opinions, analyses, and information included herein are based on sources believed to be reliable, but no representation or warranty of any kind, expressed or implied, is made including but not limited to any representation or warranty concerning accuracy, completeness, correctness, timeliness or appropriateness. We undertake no obligation to update such opinions, analysis or information. You should independently verify all information contained on this website. Some information is based on analysis of past performance or hypothetical performance results, which have inherent limitations. We make no representation that any particular equity or strategy will or is likely to achieve profits or losses similar to those shown. Shareholders, employees, writers, contractors, and affiliates associated with ETFOptimize.com may have ownership positions in the securities that are mentioned. If you are not sure if ETFs, algorithmic investing, or a particular investment is right for you, you are urged to consult with a Registered Investment Advisor (RIA). Neither this website nor anyone associated with producing its content are Registered Investment Advisors, and no attempt is made herein to substitute for personalized, professional investment advice. Neither ETFOptimize.com, Global Alpha Investments, Inc., nor its employees, service providers, associates, or affiliates are responsible for any investment losses you may incur as a result of using the information provided herein. Remember that past investment returns may not be indicative of future returns.

Copyright © 1998-2017 ETFOptimize.com, a publication of Optimized Investments, Inc. All rights reserved.