ETFOptimize | High-performance ETF-based Investment Strategies

Quantitative strategies, Wall Street-caliber research, and insightful market analysis since 1998.


ETFOptimize | HOME
Close Window

Super Micro Computer Stock Outlook: Is Wall Street Bullish or Bearish?

San Jose, California-based Super Micro Computer, Inc. (SMCI) develops and manufactures advanced server and storage solutions built on a modular and open architecture. Valued at $30.2 billion by market cap, the company offers servers, storage systems, motherboards, full racks, chassis, and accessories worldwide. 

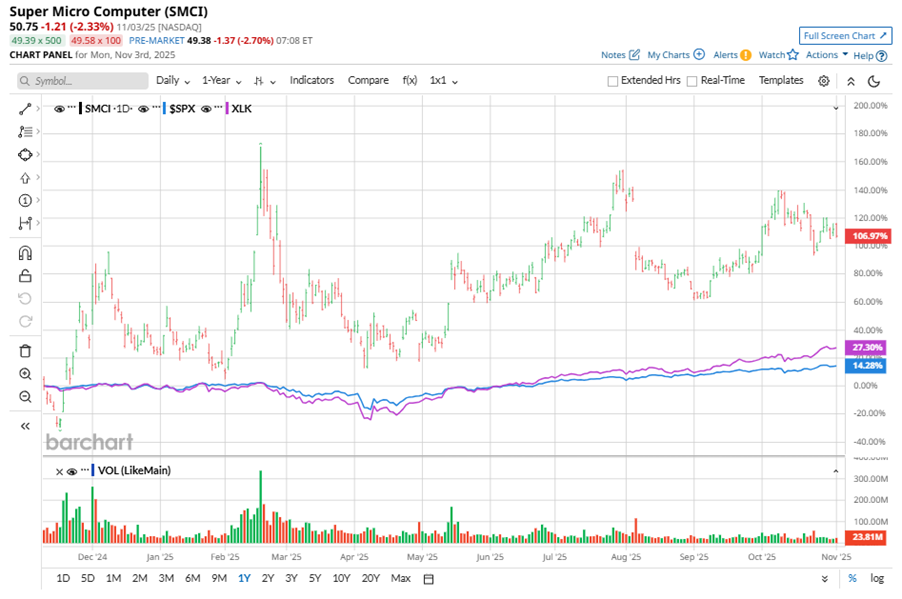
Shares of this AI server giant have significantly outperformed the broader market over the past year. SMCI has gained 94.8% over this time frame, while the broader S&P 500 Index ($SPX) has rallied nearly 19.6%. In 2025, SMCI stock is up 66.5%, surpassing SPX’s 16.5% rise on a YTD basis. 


Zooming in further, SMCI’s outperformance is also apparent compared to the Technology Select Sector SPDR Fund (XLK). The exchange-traded fund has gained about 34.8% over the past year. Moreover, SMCI’s gains on a YTD basis outshine the ETF’s 29.8% returns over the same time frame. 

www.barchart.com

SMCI's performance boost comes from new partnerships and record-breaking results in high-performance computing and AI server solutions. The company, in collaboration with Intel Corporation (INTC) and Micron Technology, Inc. (MU), set new world records in the STAC-M3 benchmark for financial databases, achieving faster query times and using fewer CPU cores. This could speed up algorithmic trading and strategy testing for financial firms.

On Aug. 5, SMCI reported its Q4 results, and its shares closed down more than 18% in the following trading session. Its net sales stood at $5.8 billion, up 7.5% year over year. The company’s adjusted EPS declined 24.1% year over year to $0.41. 

For fiscal 2026, ended in June 2026, analysts expect SMCI’s EPS to grow 23.8% to $2.13 on a diluted basis. The company’s earnings surprise history is disappointing. It missed the consensus estimates in two of the last three quarters while beating the forecast on another occasion.

Among the 19 analysts covering SMCI stock, the consensus is a “Hold.” That’s based on four “Strong Buy” ratings, three “Moderate Buys,” nine “Holds,” one “Moderate Sell,” and two “Strong Sells.”

www.barchart.com

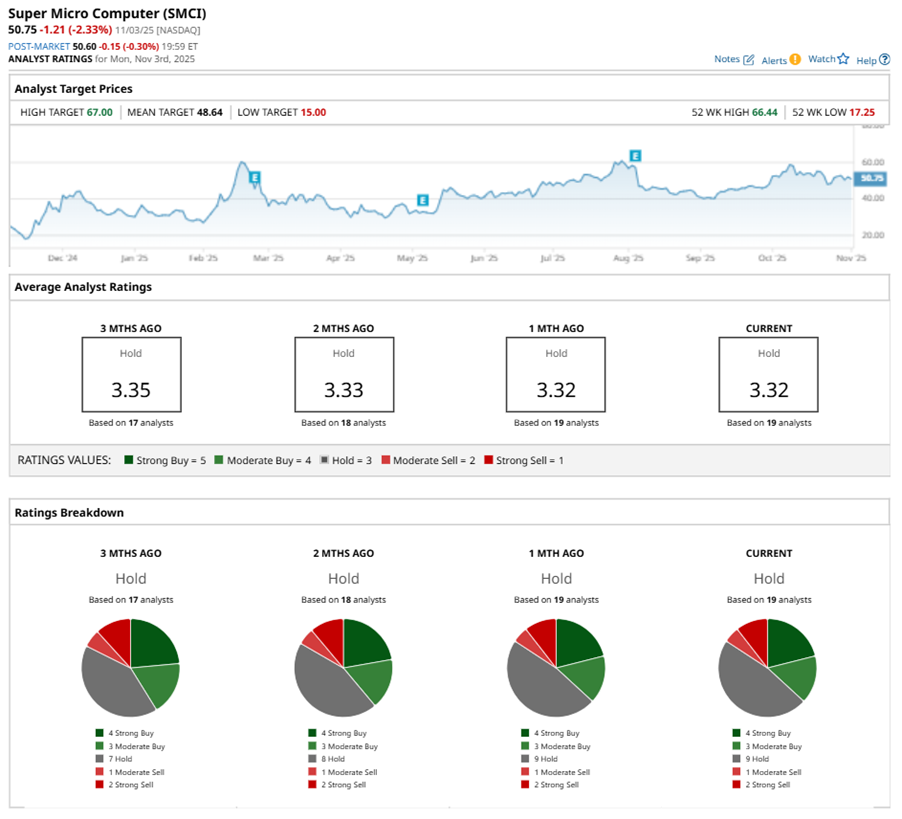
The configuration has been relatively stable over the past three months. 

On Oct. 24, JPMorgan Chase & Co. (JPM) kept a “Neutral” rating on SMCI and lowered the price target to $43.

While SMCI currently trades above its mean price target of $48.64, the Street-high price target of $67 suggests a 32% upside potential. 


On the date of publication, Neha Panjwani did not have (either directly or indirectly) positions in any of the securities mentioned in this article. All information and data in this article is solely for informational purposes. For more information please view the Barchart Disclosure Policy here.


More news from Barchart

Recent Quotes

View More
Symbol Price Change (%)
AMZN  249.46
-4.54 (-1.79%)
AAPL  270.04
+0.99 (0.37%)
AMD  250.05
-9.60 (-3.70%)
BAC  53.54
-0.02 (-0.04%)
GOOG  278.06
-6.06 (-2.13%)
META  627.32
-10.39 (-1.63%)
MSFT  514.33
-2.70 (-0.52%)
NVDA  198.69
-8.19 (-3.96%)
ORCL  248.17
-9.68 (-3.75%)
TSLA  444.26
-24.11 (-5.15%)
Stock Quote API & Stock News API supplied by www.cloudquote.io
Quotes delayed at least 20 minutes.
By accessing this page, you agree to the Privacy Policy and Terms Of Service.


IntelligentValue Home
Close Window

DISCLAIMER

All content herein is issued solely for informational purposes and is not to be construed as an offer to sell or the solicitation of an offer to buy, nor should it be interpreted as a recommendation to buy, hold or sell (short or otherwise) any security.  All opinions, analyses, and information included herein are based on sources believed to be reliable, but no representation or warranty of any kind, expressed or implied, is made including but not limited to any representation or warranty concerning accuracy, completeness, correctness, timeliness or appropriateness. We undertake no obligation to update such opinions, analysis or information. You should independently verify all information contained on this website. Some information is based on analysis of past performance or hypothetical performance results, which have inherent limitations. We make no representation that any particular equity or strategy will or is likely to achieve profits or losses similar to those shown. Shareholders, employees, writers, contractors, and affiliates associated with ETFOptimize.com may have ownership positions in the securities that are mentioned. If you are not sure if ETFs, algorithmic investing, or a particular investment is right for you, you are urged to consult with a Registered Investment Advisor (RIA). Neither this website nor anyone associated with producing its content are Registered Investment Advisors, and no attempt is made herein to substitute for personalized, professional investment advice. Neither ETFOptimize.com, Global Alpha Investments, Inc., nor its employees, service providers, associates, or affiliates are responsible for any investment losses you may incur as a result of using the information provided herein. Remember that past investment returns may not be indicative of future returns.

Copyright © 1998-2017 ETFOptimize.com, a publication of Optimized Investments, Inc. All rights reserved.