Ross Stores, Inc. (ROST) is a leading off-price retailer in the U.S., known for offering discounted brand-name clothing, footwear, accessories, and home décor. Based in Dublin, California, the company operates two leading store chains: Ross Dress for Less and dd’s DISCOUNTS.
By strategically purchasing excess inventory and closeout merchandise from suppliers, Ross Stores minimizes costs while delivering strong value to shoppers. Its efficient operations and low-cost structure have helped the retailer expand to more than 2,000 locations across the country. The company has a market capitalization of $52.76 billion.
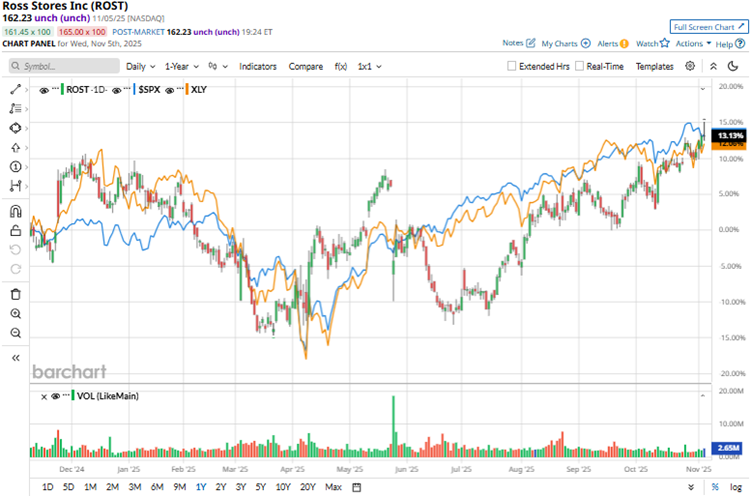
The demand for off-price retail has kept the stock buoyant, but it has faced pressures like margin challenges. Over the past 52 weeks, the stock has gained 14%, while it is up 14.7% over the past six months. Based on a price target raise, the stock reached a 52-week high of $165.07 on Nov. 5, but is down 1.7% from that level.
The S&P 500 Index ($SPX) has gained 17.5% and 20.3% over the same periods, respectively, which reflects that the stock is underperforming the broader market. The nature of Ross Stores’ business classifies it as a consumer discretionary stock. Comparing it with the Consumer Discretionary Select Sector SPDR Fund (XLY), we see that the ETF has risen 18.8% over the past 52 weeks and 21% over the past six months, outperforming Ross Stores’ stock.
On Aug. 21, Ross Stores reported its second-quarter results for fiscal 2025 (the quarter ended Aug. 2). In that, the company’s sales increased 4.6% year-over-year (YOY) to $5.53 billion, which met Wall Street analysts’ forecast. Its comparable store sales were up 2% compared to the same period last year. Although tariff-related costs have put pressure on its bottom line, as EPS declined 1.9% YOY to $1.56, it is still higher than the consensus estimate of $1.52.
However, tariff costs have led to subdued guidance from Ross Stores. EPS for the third quarter is expected to be in the range of $1.31 - $1.37 compared to $1.48 in the prior-year quarter, and $1.74 - $1.81 for the fourth quarter compared to $1.79.
For the current fiscal year, which ends in January 2026, Wall Street analysts expect Ross Stores’ EPS to decline 2.1% YOY to $6.19 on a diluted basis. However, EPS is expected to increase 10.3% annually to $6.83 in the next fiscal year. On the other hand, the company has a solid history of consistently surpassing consensus estimates, topping them in all four of its trailing quarters.
Among the 21 Wall Street analysts covering Ross Stores’ stock, the consensus is a “Strong Buy.” That’s based on 15 “Strong Buy” ratings and six “Holds.” The ratings configuration is more bullish than it was a month ago, with 15 “Strong Buy” ratings now, up from 14 previously.
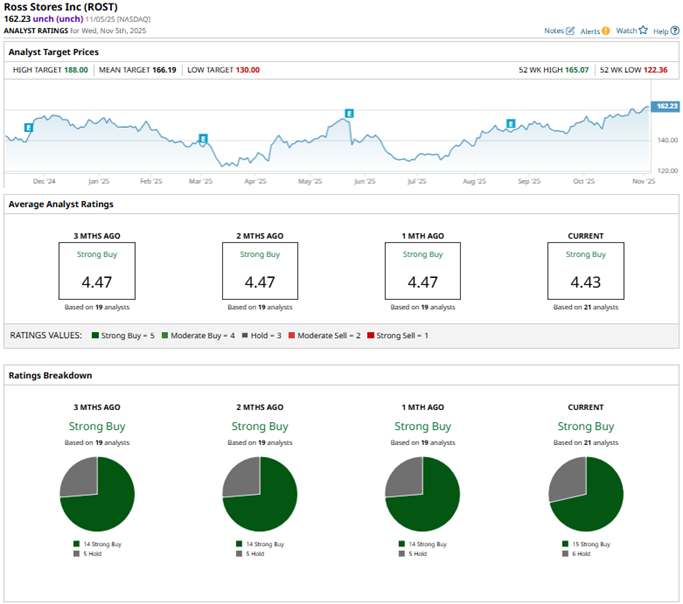
On Nov. 5, UBS analyst Jay Sole reaffirmed a “Neutral” rating on Ross Stores’s stock, while raising the price target from $147 to $163, reflecting improving confidence. Last month, Wells Fargo analyst Ike Boruchow kept an “Overweight” rating, while raising the price target from $175 to $180.
Ross Stores’ mean price target of $166.19 indicates a 2.4% upside over current market prices. The Street-high price target of $188 implies a potential upside of 15.9%.
On the date of publication, Anushka Mukherjee did not have (either directly or indirectly) positions in any of the securities mentioned in this article. All information and data in this article is solely for informational purposes. For more information please view the Barchart Disclosure Policy here.
More news from Barchart