Houston, Texas-based Baker Hughes Company (BKR) provides oilfield products, services, and digital solutions. Valued at $45.4 billion by market cap, BKR is one of the world's largest oilfield service providers offering drilling, well intervention, decommissioning, surface pressure control, onshore composite pipe, reservoir technical, and integrated well services.
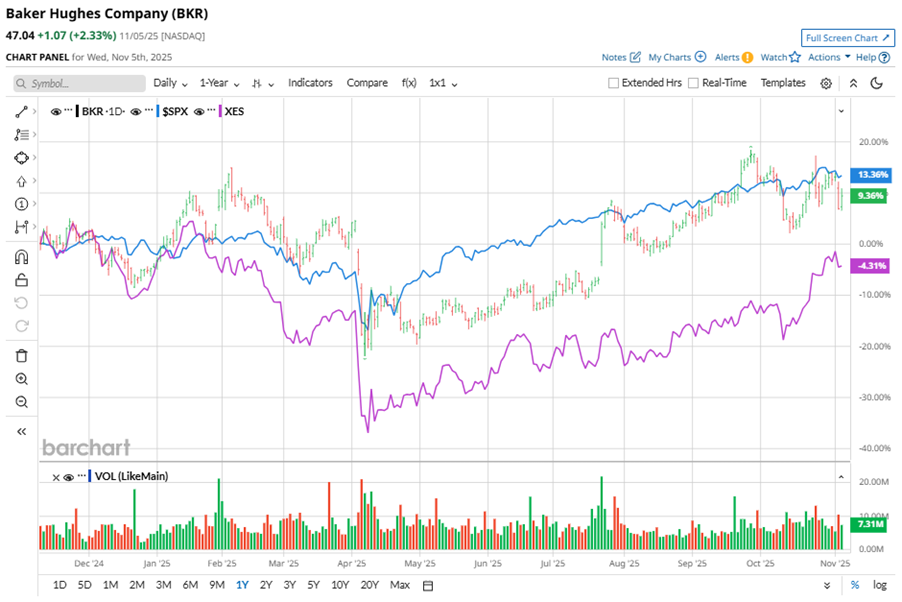
Shares of this leading energy technology company have outperformed the broader market over the past year. BKR has gained 21.9% over this time frame, while the broader S&P 500 Index ($SPX) has rallied nearly 17.5%. However, in 2025, BKR stock is up 14.7%, compared to the SPX’s 15.6% rise on a YTD basis.
Zooming in further, BKR’s outperformance is also apparent compared to the SPDR S&P Oil & Gas Equipment & Services ETF (XES). The exchange-traded fund has gained about 1.3% over the past year. Moreover, BKR’s double-digit gains on a YTD basis outshine the ETF’s 1.6% returns over the same time frame.
BKR's strong performance is driven by its Industrial & Energy Technology segment, which has achieved record LNG equipment bookings and power generation growth. Its key wins include major LNG contracts and the adoption of its Cordant software and gas turbine tech for geothermal projects. The company also completed a strategic acquisition and sees a $40 billion opportunity in gas infrastructure and energy efficiency by 2028.
On Oct. 23, BKR shares closed up more than 3% after reporting its Q3 results. Its adjusted EPS of $0.68 surpassed Wall Street expectations of $0.61. The company’s revenue was $7 billion, exceeding Wall Street forecasts of $6.8 billion.
For the current fiscal year, ending in December, analysts expect BKR’s EPS to grow 3.8% to $2.44 on a diluted basis. The company’s earnings surprise history is impressive. It beat the consensus estimate in each of the last four quarters.
Among the 20 analysts covering BKR stock, the consensus is a “Strong Buy.” That’s based on 14 “Strong Buy” ratings, two “Moderate Buys,” and four “Holds.”
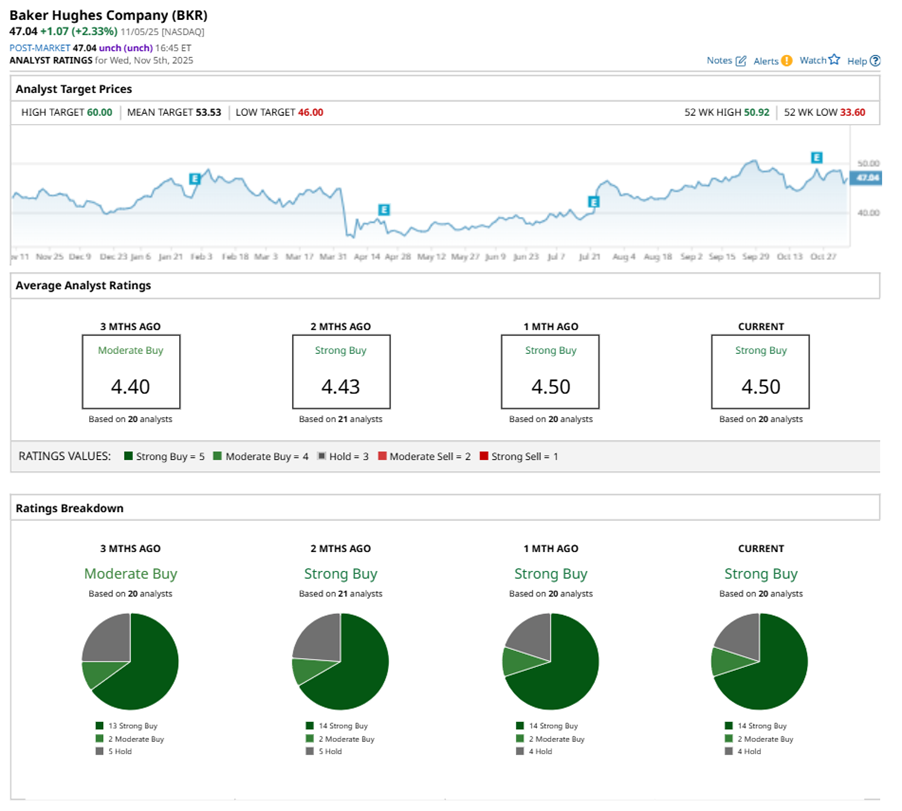
This configuration is more bullish than three months ago, with 13 analysts suggesting a “Strong Buy.”
On Oct. 28, Citigroup Inc. (C) analyst Scott Gruber kept a “Buy” rating on BKR and lowered the price target to $55, implying a potential upside of 16.9% from current levels.
The mean price target of $53.53 represents a 13.8% premium to BKR’s current price levels. The Street-high price target of $60 suggests an ambitious upside potential of 27.6%.
On the date of publication, Neha Panjwani did not have (either directly or indirectly) positions in any of the securities mentioned in this article. All information and data in this article is solely for informational purposes. For more information please view the Barchart Disclosure Policy here.
More news from Barchart