New Britain, Connecticut-based Stanley Black & Decker, Inc. (SWK) provides hand tools, power tools, outdoor products, related accessories, engineered fastening systems, and several other items and services. With a market cap of $10.8 billion, the company's operations span the Americas, Europe, and Asia.
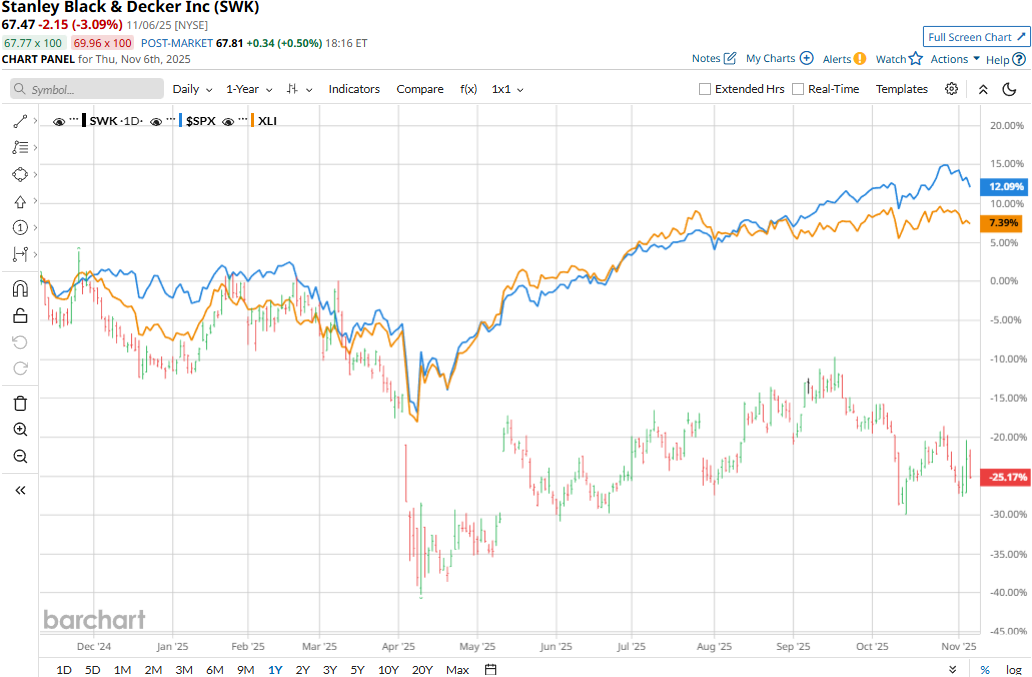
The tools and accessories giant has significantly underperformed the broader market over the past year. SWK stock has plummeted 26.7% over the past 52 weeks and 16% on a YTD basis, compared to the S&P 500 Index’s ($SPX) 13.4% gains over the past year and 14.3% returns in 2025.
Narrowing the focus, SWK has also underperformed the sector-focused Industrial Select Sector SPDR Fund’s (XLI) 7.9% gains over the past 52 weeks and 15.8% surge on a YTD basis.
Stanley Black & Decker’s stock prices observed a marginal uptick in the trading session following the release of its mixed Q3 results on Nov. 4. The company’s topline has remained under pressure due to declining sales volumes. In Q3, its volumes again dropped by 6%, which was offset by price gains and favorable currency movements. Overall, its net revenues came in at $3.8 billion, up 13 bps year-over-year and 35 bps below the Street’s expectations.
Further, the company has been focused on improving efficiency and reducing costs, but its adjusted S&A expenses as a percentage of sales increased from 20.8% in the year-ago quarter to 21%. Nonetheless, its adjusted EPS grew from $1.22 in Q3 2024 to $1.43, surpassing the consensus estimates by 20.2%.
For the full fiscal 2025, ending in December, analysts expect SWK to deliver an adjusted EPS of $4.55, up 4.4% year-over-year. On a more positive note, the company has a solid earnings surprise history. It has surpassed the Street’s bottom-line estimates in each of the past four quarters by notable margins.
Among the 17 analysts covering the SWK stock, the consensus rating is a “Moderate Buy.” That’s based on six “Strong Buys,” 10 “Holds,” and one “Strong Sell.”
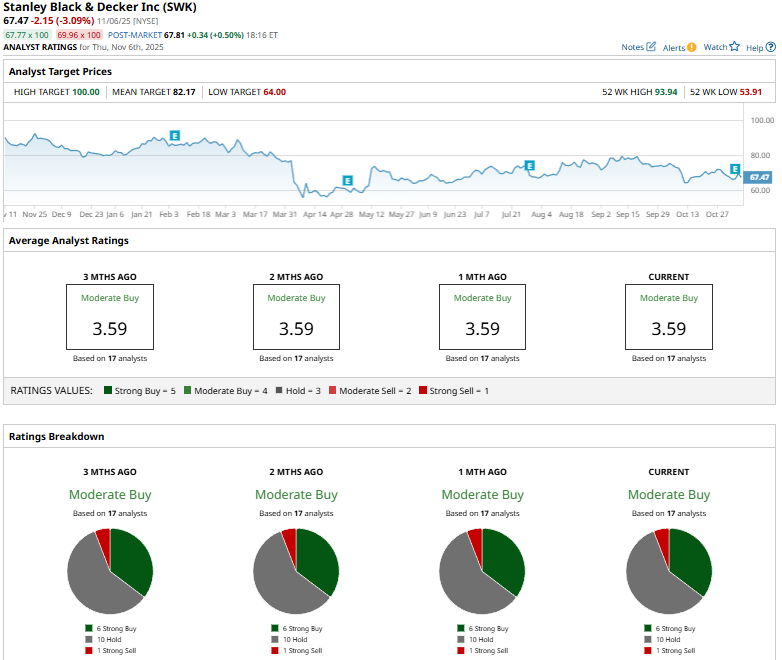
This configuration has remained stable in recent months.
On Nov. 5, Wells Fargo (WFC) analyst Joseph O'Dea reiterated an “Equal-Weight” rating on SWK, but lowered the price target from $80 to $75.
As of writing, SWK’s mean price target of $82.17 represents a 21.8% premium to current price levels. Meanwhile, the street-high target of $100 suggests a staggering 48.2% upside potential.
On the date of publication, Aditya Sarawgi did not have (either directly or indirectly) positions in any of the securities mentioned in this article. All information and data in this article is solely for informational purposes. For more information please view the Barchart Disclosure Policy here.
More news from Barchart
- Verizon Is Getting an Amazon Data Center Boost. Should You Buy the High-Yield Dividend Stock Here?
- ServiceNow Just Announced a 5-for-1 Stock Split. So, Is Now the Time to Buy NOW Stock?
- Palantir Is Getting a Bigger Seat at the Defense Table. Does That Make PLTR Stock a Buy Here?
- Analysts Say ‘We Would Be Aggressive Buyers on Any Pullbacks’ in Microsoft Stock. Should You Be Too?