Copper prices are heading higher as the market braces for a sizable deficit in 2026. Analysts now expect global demand to outrun new supply by a wide margin, reversing the modest surpluses seen in recent years.
The main drivers are straightforward: the rollout of renewables, electric vehicles, and grid upgrades will require massive amounts of new copper, while general economic growth and infrastructure spending in both developed and emerging markets add further pressure. With mining output growing slowly and few large new projects coming online soon, the stage is set for tighter conditions and rising prices.
Key contributing factors to copper demand in 2026 include:
- Global Electrification and Energy Transition: The push for decarbonization and energy security makes copper a critical metal. This involves substantial demand from:
- Electric Vehicles (EVs): The EV market requires a significant amount of copper for motors, wiring, and charging infrastructure.
- Renewable Energy Sources: Copper is integral to wind and solar power generation systems.
- Power Grids: The expansion and upgrade of power grids to handle new energy sources and increased consumption will consume large volumes of copper.
- Infrastructure and Data Centers: Ongoing global urbanization, particularly in the Asia-Pacific region, continues to drive demand for construction and electrical applications. The rapid expansion of data centers to support emerging technologies also contributes significantly to demand.
- Global Economic Recovery: Analysts, including those from Morgan Stanley and the IMF, project a moderate pickup in global economic growth in 2026, with growth expected to increase from 3% in 2025 to around 3.2% in 2026.
- Supply Constraints: A key dynamic is that while demand is rising, structural supply issues—such as declining ore grades, lack of new significant mine discoveries, and operational disruptions at existing mines (e.g., Grasberg in Indonesia)—are expected to constrain production, exacerbating the supply deficit.
The International Copper Study Group (ICSG) forecasts a refined copper deficit of around 150,000 tons in 2026, while other analysts project an even larger shortfall of over 400,000 tons. This imbalance between demand and constrained supply is a significant factor in bullish copper price forecasts for 2026, with many analysts expecting prices to remain elevated or reach new highs.
Copper Market Technical Picture
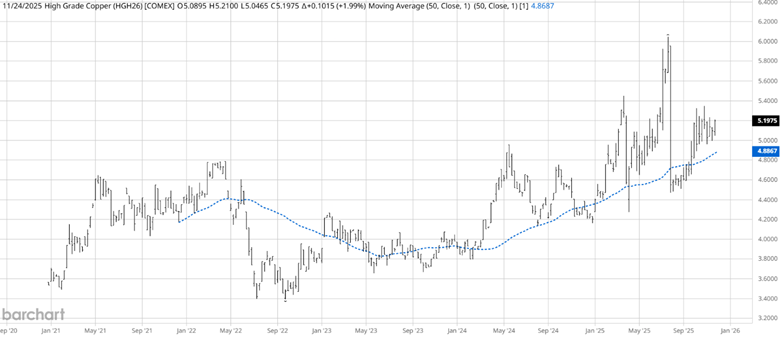
Source: Barchart
The weekly chart of the March 2026 copper futures contract shows the market has been in an uptrend since hitting a contract low of $3.3940 on September 26, 2022. As the trend has matured, March copper prices have set multiple new contract highs, including the recent high of $6.0460 on July 21, 2025. The 50-week moving average has served as support for this uptrend during price corrections.
Seasonal Analysis
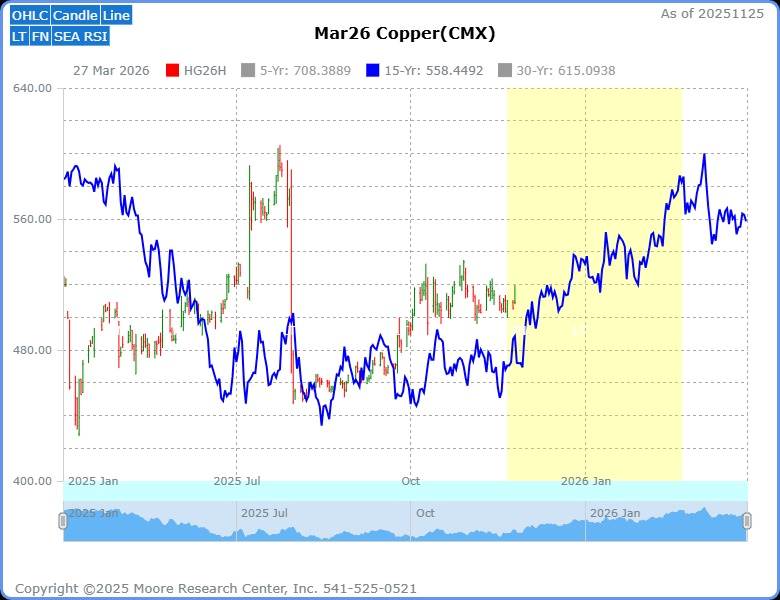
Source: Moore Research Center, Inc. (MRCI)
Through extensive research, MRCI has identified a 15-year seasonal pattern (blue) showing a seasonal low around mid-August. Through further research, they have identified an optimal seasonal window (yellow area) before the copper market makes a significant upmove. Historically, March copper prices have closed higher on February 21 than on November 21 for 13 of the past 15 years, an 87% occurrence rate. Allowing traders to trade a core position or possibly trade in a bullish bias during the seasonal window. During the hypothetical testing, the average net profit per trade was 22.21 handles (points) or $5,551.67 per standard contract.
As a crucial reminder, while seasonal patterns can provide valuable insights, they should not be the basis for trading decisions. Traders must consider various technical and fundamental indicators, risk management strategies, and market conditions to make informed, balanced trading decisions.
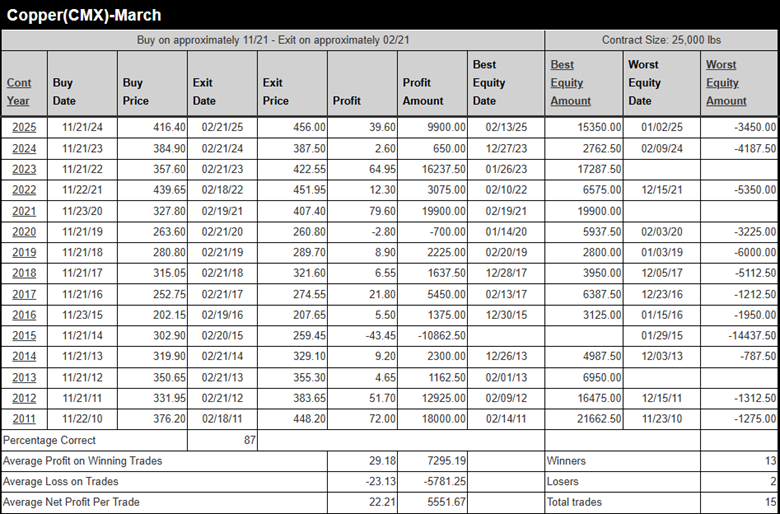
Source: MRCI
During these 15 years, the strategy had 3 years without daily closing drawdowns.
Market Correlations
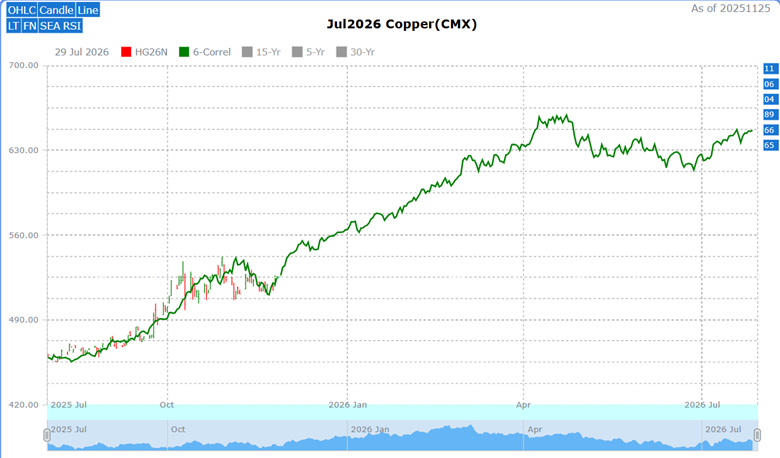
Source: MRCI
Copper futures contract months are closely correlated and can change by different increments from day to day, but they generally move in lockstep in the same direction. The July copper futures contract has an interesting 6-year market correlation (green): 2011: 91%; 2006: 88%; 2004: 87%; 1989: 89%; 1966: 90%; 1965: 87%: all six correlate 87% or higher.
Historically, these 6 years have closed higher in the fourth and first quarters than they opened. Will this six-year correlation, a seasonal buying window, and the fundamentals support higher prices?
Assets to Trade the Copper Market
Traders can participate using these CME products:
- Standard Copper Futures (HG): Each contract represents 25,000 pounds of copper; each tick (0.0005 per pound) is $12.50 in US dollars. Ideal for institutional and experienced traders.
- Micro Copper Futures (QL): A reduced contract size of 2,500 pounds, with lower margin requirements, making it ideal for retail traders. Each tick (0.0005 per pound) is worth $1.25 per contract.
- Options on Copper Futures: Buy call options to profit from a price rise with limited risk, or sell put options to collect premiums if prices stay flat or rise.
In Closing….
Copper faces a clear supply deficit in 2026, with demand expected to outpace new production by 150,000 to over 400,000 tons. The push comes from electric vehicles, renewable energy projects, grid upgrades, data centers, and a modest global growth pickup to around 3.2%. On the supply side, aging mines, lower ore grades, and a few significant new projects keep output constrained. This structural imbalance points to higher prices ahead.
The technical and seasonal setups support the bullish case: March 2026 copper futures are in a multi-year uptrend, trading near all-time highs, and a reliable seasonal pattern shows strength from late November into February (an 87% win rate over 15 years). For traders, standard HG futures, micro QL contracts, or options on the CME Group exchange offer direct ways to play it. Still, do your own research and manage risk—fundamentals can shift, and no pattern is guaranteed.
On the date of publication, Don Dawson did not have (either directly or indirectly) positions in any of the securities mentioned in this article. All information and data in this article is solely for informational purposes. For more information please view the Barchart Disclosure Policy here.
More news from Barchart


