ETFOptimize | High-performance ETF-based Investment Strategies

Quantitative strategies, Wall Street-caliber research, and insightful market analysis since 1998.


ETFOptimize | HOME
Close Window

How Is Constellation Energy's Stock Performance Compared to Other Utilities Stocks?

Constellation Energy Corporation (CEG), headquartered in Baltimore, Maryland, produces and sells energy products and services. With a market cap of $113.8 billion, the company generates and distributes nuclear, hydro, wind, and solar energy solutions serving homes, institutional customers, public sectors, community aggregations, and businesses.

Companies worth $10 billion or more are generally described as “large-cap stocks,” and CEG perfectly fits that description, with its market cap exceeding this mark, underscoring its size, influence, and dominance within the utilities - renewable industry. CEG’s growth is driven by its diverse energy portfolio, including nuclear, wind, solar, and hydroelectric assets.


Despite its notable strength, CEG slipped 11.7% from its 52-week high of $412.70, achieved on Oct. 15. Over the past three months, CEG stock gained 14%, outperforming the Utilities Select Sector SPDR Fund’s (XLU7.1% gains during the same time frame.

www.barchart.com

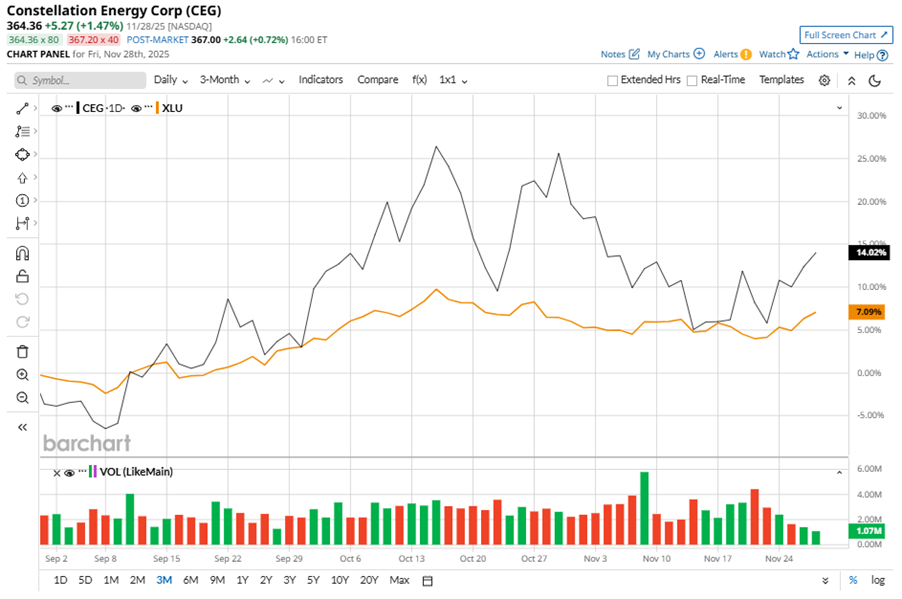
In the longer term, shares of CEG rose 62.9% on a YTD basis and climbed 43.8% over the past 52 weeks, considerably outperforming XLU’s YTD gains of 19.7% and 9.3% returns over the last year.

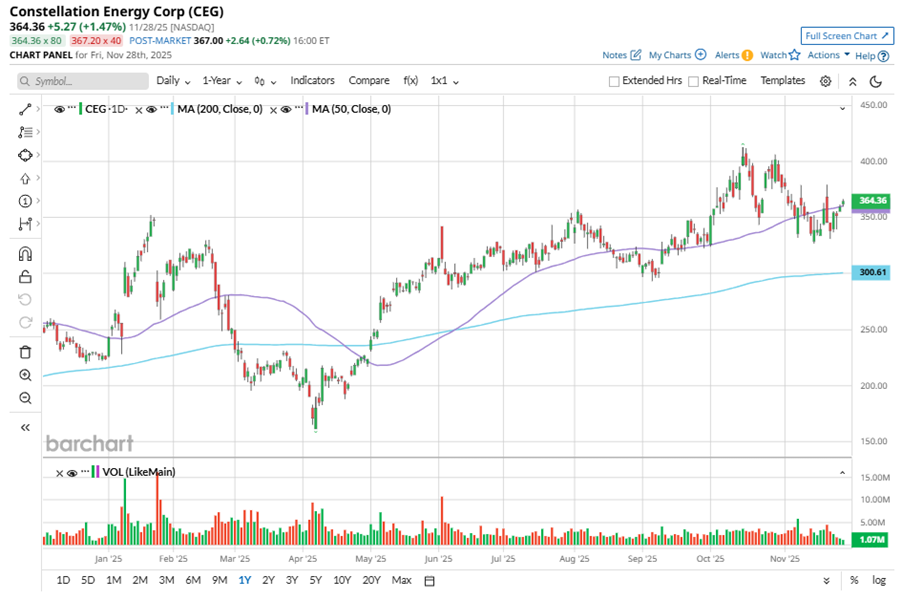
To confirm the bullish trend, CEG has been trading above its 50-day and 200-day moving averages since early May, experiencing some fluctuations.

www.barchart.com

CEG excels with the U.S.'s most significant nuclear fleet with a 22-gigawatt capacity. As AI drives energy demand, CEG's nuclear power positions it perfectly, delivering about 58% returns in 2025. The company has secured multiple agreements with AI hyperscalers, notably a 20-year deal with Microsoft Corporation (MSFT), which boosted its shares by over 22% and underscores the company’s strategic positioning in the market.

On Nov. 7, CEG shares closed up more than 2% after reporting its Q3 results. Its adjusted EPS increased 10.9% year over year to $3.04. The company’s revenue stood at $6.6 billion, up marginally from the year-ago quarter. 

CEG’s rival, Brookfield Renewable Partners L.P. (BEP) shares lagged behind the stock, with a 25.9% gain on a YTD basis and a 9% rise over the past 52 weeks. 

Wall Street analysts are reasonably bullish on CEG’s prospects. The stock has a consensus “Moderate Buy” rating from the 17 analysts covering it, and the mean price target of $401.88 suggests a potential upside of 10.3% from current price levels.


On the date of publication, Neha Panjwani did not have (either directly or indirectly) positions in any of the securities mentioned in this article. All information and data in this article is solely for informational purposes. For more information please view the Barchart Disclosure Policy here.


More news from Barchart

Recent Quotes

View More
Symbol Price Change (%)
AMZN  232.66
-1.76 (-0.75%)
AAPL  286.65
+0.46 (0.16%)
AMD  215.75
+0.50 (0.23%)
BAC  53.73
+0.54 (1.01%)
GOOG  320.65
+4.63 (1.47%)
META  643.26
-3.84 (-0.59%)
MSFT  480.92
-9.08 (-1.85%)
NVDA  181.07
-0.39 (-0.21%)
ORCL  204.77
+3.67 (1.83%)
TSLA  441.33
+12.09 (2.82%)
Stock Quote API & Stock News API supplied by www.cloudquote.io
Quotes delayed at least 20 minutes.
By accessing this page, you agree to the Privacy Policy and Terms Of Service.


IntelligentValue Home
Close Window

DISCLAIMER

All content herein is issued solely for informational purposes and is not to be construed as an offer to sell or the solicitation of an offer to buy, nor should it be interpreted as a recommendation to buy, hold or sell (short or otherwise) any security.  All opinions, analyses, and information included herein are based on sources believed to be reliable, but no representation or warranty of any kind, expressed or implied, is made including but not limited to any representation or warranty concerning accuracy, completeness, correctness, timeliness or appropriateness. We undertake no obligation to update such opinions, analysis or information. You should independently verify all information contained on this website. Some information is based on analysis of past performance or hypothetical performance results, which have inherent limitations. We make no representation that any particular equity or strategy will or is likely to achieve profits or losses similar to those shown. Shareholders, employees, writers, contractors, and affiliates associated with ETFOptimize.com may have ownership positions in the securities that are mentioned. If you are not sure if ETFs, algorithmic investing, or a particular investment is right for you, you are urged to consult with a Registered Investment Advisor (RIA). Neither this website nor anyone associated with producing its content are Registered Investment Advisors, and no attempt is made herein to substitute for personalized, professional investment advice. Neither ETFOptimize.com, Global Alpha Investments, Inc., nor its employees, service providers, associates, or affiliates are responsible for any investment losses you may incur as a result of using the information provided herein. Remember that past investment returns may not be indicative of future returns.

Copyright © 1998-2017 ETFOptimize.com, a publication of Optimized Investments, Inc. All rights reserved.