Valued at a market cap of $58.1 billion, Air Products and Chemicals, Inc. (APD) is a leading industrial gases company that supplies hydrogen, nitrogen, oxygen, helium, and specialty gases to customers across refining, chemicals, manufacturing, electronics, metals, and healthcare industries. The Allentown, Pennsylvania-based company also builds and operates large-scale gas production facilities and provides equipment and services for gas processing, air separation, and liquefied natural gas (LNG).
Companies valued at $10 billion or more are typically classified as “large-cap stocks,” and APD fits the label perfectly, with its market cap exceeding this threshold, underscoring its size, influence, and dominance within the specialty chemicals industry. With a strong project pipeline, long-term customer contracts, and a capital-intensive business model that supports durable cash flow, the company remains a major player in the industrial gases and clean energy infrastructure market.
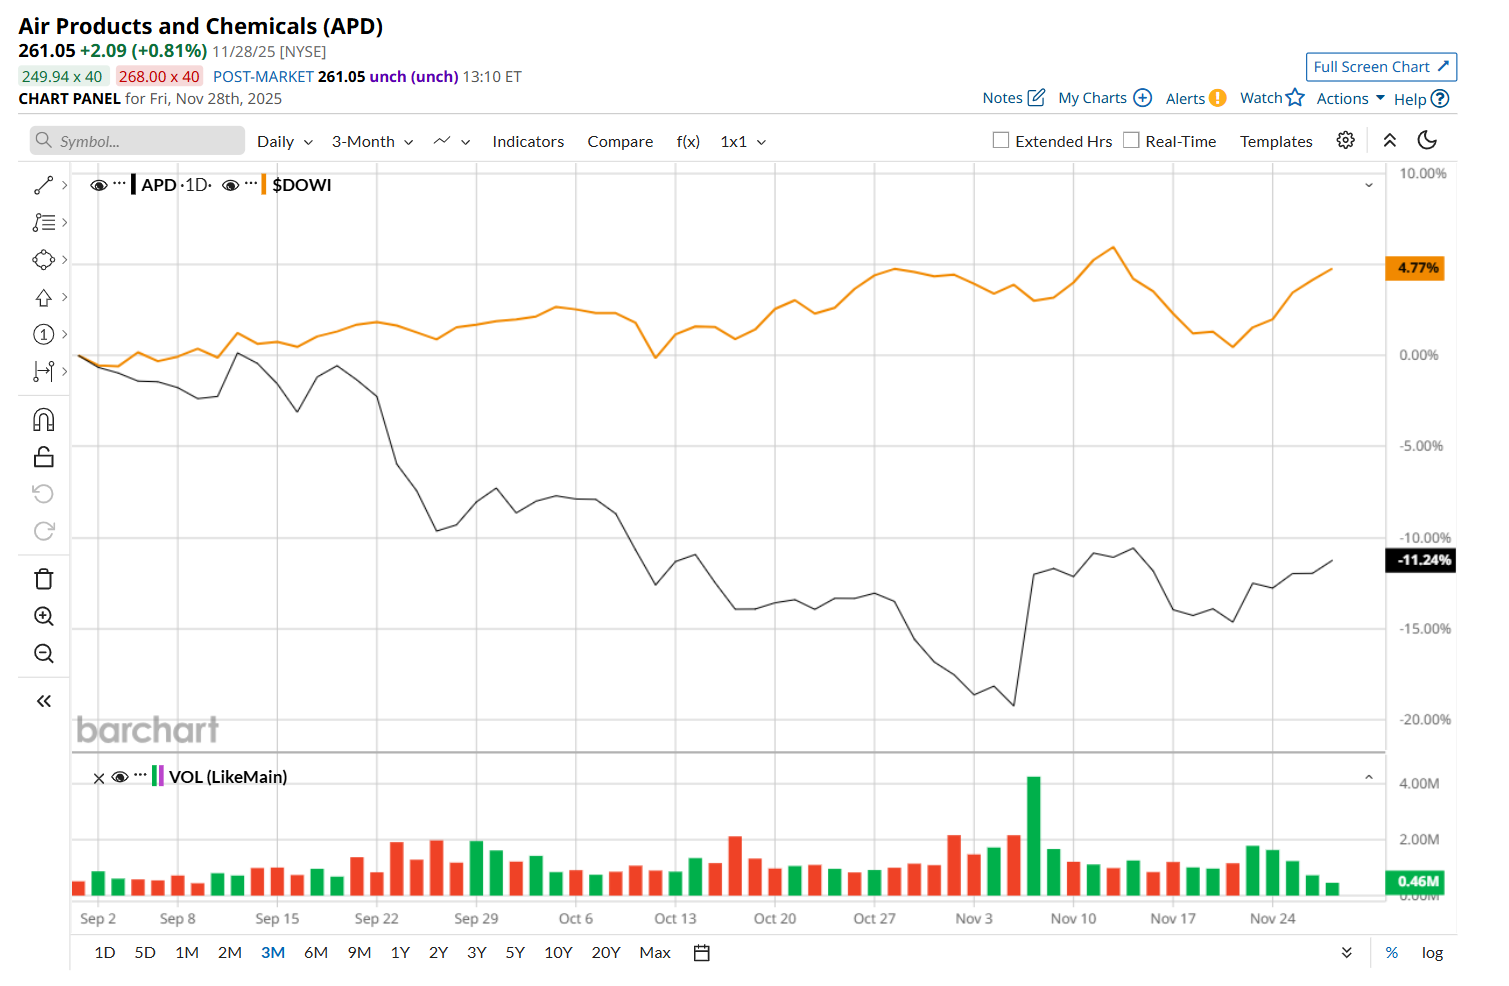
This industrial gases company has slipped 23.5% from its 52-week high of $341.14, reached on Feb. 4. Shares of APD have declined 11.5% over the past three months, lagging behind the Dow Jones Industrial Average’s ($DOWI) 4.6% rise during the same time frame.
In the longer term, APD has fallen 21.7% over the past 52 weeks, notably underperforming DOWI's 6.7% uptick over the same time period. Moreover, on a YTD basis, shares of APD are down 10%, compared to DOWI’s 12.2% return.
To confirm its bearish trend, APD has been trading below its 200-day moving average since mid-March, with slight fluctuations, and has remained below its 50-day moving average since mid-September, with minor fluctuations.

Shares of APD rose 8.9% after its Q4 earnings release on Nov. 4. The company’s revenue declined marginally year-over-year to $3.2 billion, largely due to lower volumes. Meanwhile, on the earnings front, its adjusted EPS of $3.39 also fell 4.8% from the year-ago quarter. However, its selling and administrative expenses decreased 3.9% from the same period last year, reflecting productivity gains and strong cost control, which helped bolster investor confidence.
APD has also underperformed its rival, Linde plc (LIN), which dropped 10.2% over the past 52 weeks and 2% on a YTD basis
Despite APD’s recent underperformance, analysts remain moderately optimistic about its prospects. The stock has a consensus rating of "Moderate Buy” from the 23 analysts covering it, and the mean price target of $308.38 suggests an 18.1% premium to its current price levels.
On the date of publication, Neharika Jain did not have (either directly or indirectly) positions in any of the securities mentioned in this article. All information and data in this article is solely for informational purposes. For more information please view the Barchart Disclosure Policy here.
More news from Barchart


