ETFOptimize | High-performance ETF-based Investment Strategies

Quantitative strategies, Wall Street-caliber research, and insightful market analysis since 1998.


ETFOptimize | HOME
Close Window

Is Northrop Grumman Stock Outperforming the Dow?

With a market cap of $81.7 billion, Northrop Grumman Corporation (NOC) is a leading U.S.-based aerospace and defense company headquartered in Falls Church, Virginia. It specializes in designing, developing, and manufacturing advanced technology systems for defense, space, and cybersecurity applications. Its core business includes unmanned systems, missile defense, aerospace platforms, cyber solutions, and space systems. 

Companies valued at $10 billion or more are generally classified as “large-cap” stocks, and Northrop Grumman fits this criterion perfectly, exceeding the mark. Northrop Grumman serves government and military clients globally, playing a critical role in national security, advanced space exploration, and defense innovation.


Despite this, shares of the company have declined 10.7% from its 52-week high of $640.90 met on Oct. 10. NOC stock has dipped 2.7% over the past three months, outpacing the broader Dow Jones Industrial Average’s ($DOWI4.6% rise over the same time frame. 

www.barchart.com

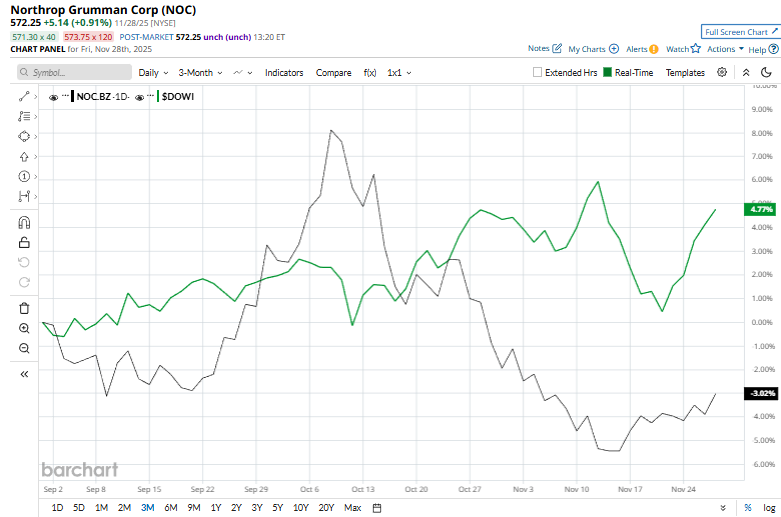
In the longer term, NOC stock is up 21.9% on a YTD basis, outperforming $DOWI’s 12.2% gain. Additionally, shares of the defense contractor have increased 17% over the past 52 weeks, surpassing $DOWI’s 5.7% rise over the same time frame.

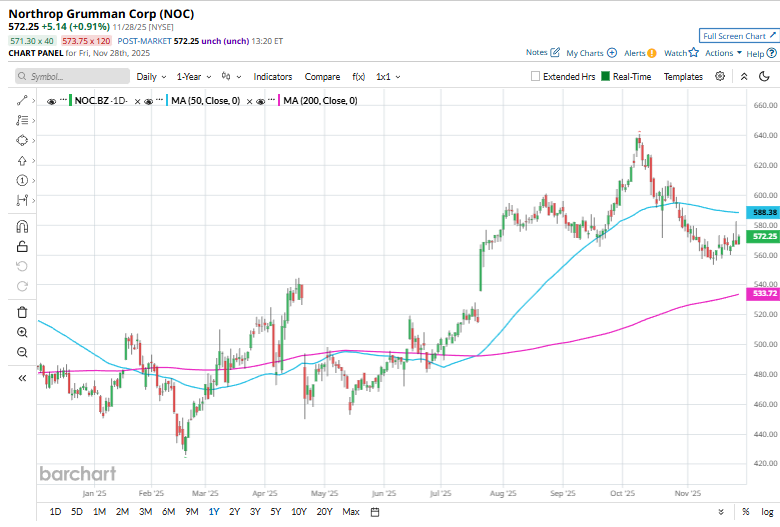
NOC stock has been trading below its 50-day moving average since the end of last month and above its 200-day moving average since early July.  

www.barchart.com

On October 21, Northrop Grumman released its third-quarter earnings, and the stock fell marginally as investors weighed the mixed results. The company delivered a strong earnings beat with adjusted EPS of $7.67, driven by improved margins across several key business segments. However, while revenue rose 4% year over year to $10.42 billion, it fell short of expectations, in part due to softer performance in the Space Systems division, which tempered overall investor enthusiasm.

Nevertheless, rival Howmet Aerospace Inc. (HWM) has outpaced NOC stock. HWM stock has climbed 87.1% on a YTD basis and 75.3% over the past 52 weeks. 

NOC stock has a consensus rating of “Moderate Buy” from 21 analysts in coverage, and the mean price target of $658.50 represents a 15.1% premium to current levels.


On the date of publication, Kritika Sarmah did not have (either directly or indirectly) positions in any of the securities mentioned in this article. All information and data in this article is solely for informational purposes. For more information please view the Barchart Disclosure Policy here.


More news from Barchart

Recent Quotes

View More
Symbol Price Change (%)
AMZN  227.35
+0.59 (0.26%)
AAPL  273.67
+1.48 (0.54%)
AMD  213.43
+12.37 (6.15%)
BAC  55.27
+1.01 (1.86%)
GOOG  308.61
+4.86 (1.60%)
META  658.77
-5.68 (-0.85%)
MSFT  485.92
+1.94 (0.40%)
NVDA  180.99
+6.85 (3.93%)
ORCL  191.97
+11.94 (6.63%)
TSLA  481.20
-2.17 (-0.45%)
Stock Quote API & Stock News API supplied by www.cloudquote.io
Quotes delayed at least 20 minutes.
By accessing this page, you agree to the Privacy Policy and Terms Of Service.


IntelligentValue Home
Close Window

DISCLAIMER

All content herein is issued solely for informational purposes and is not to be construed as an offer to sell or the solicitation of an offer to buy, nor should it be interpreted as a recommendation to buy, hold or sell (short or otherwise) any security.  All opinions, analyses, and information included herein are based on sources believed to be reliable, but no representation or warranty of any kind, expressed or implied, is made including but not limited to any representation or warranty concerning accuracy, completeness, correctness, timeliness or appropriateness. We undertake no obligation to update such opinions, analysis or information. You should independently verify all information contained on this website. Some information is based on analysis of past performance or hypothetical performance results, which have inherent limitations. We make no representation that any particular equity or strategy will or is likely to achieve profits or losses similar to those shown. Shareholders, employees, writers, contractors, and affiliates associated with ETFOptimize.com may have ownership positions in the securities that are mentioned. If you are not sure if ETFs, algorithmic investing, or a particular investment is right for you, you are urged to consult with a Registered Investment Advisor (RIA). Neither this website nor anyone associated with producing its content are Registered Investment Advisors, and no attempt is made herein to substitute for personalized, professional investment advice. Neither ETFOptimize.com, Global Alpha Investments, Inc., nor its employees, service providers, associates, or affiliates are responsible for any investment losses you may incur as a result of using the information provided herein. Remember that past investment returns may not be indicative of future returns.

Copyright © 1998-2017 ETFOptimize.com, a publication of Optimized Investments, Inc. All rights reserved.