Meteorological winter got underway Monday, meaning the Grains sector winter quarter has begun.
Seasonal Analysis move to the forefront, for some, with the focus on National Cash Indexes, or the markets' intrinsic values.
Don’t Miss a Day: From crude oil to coffee, sign up free for Barchart’s best-in-class commodity analysis.Corn and soybeans tend to rally during the winter while wheat endures what I like to call the Krampus Countdown.
Mondays are what they are, but today (December 1) has that little something extra: It's the first day of meteorological winter. This will bring joy to some, those folks who look forward to the cold outside as they either retreat inside for warming beverages or act as snowbirds and head south, to warmer climes for the season. To others, it’s the opposite of joy. As parts of the US Plains and Midwest continue to dig out from a late fall/early winter storm that barreled through this past holiday weekend, let's take a few moments to talk about markets, and seasonal analysis.
Seasonal analysis is a school of thought that comes up around this time each year. Why? Because there is nothing else to talk about. Not only does the turn of the calendar page from November to December mark winter’s arrival, it also means travel season has come. Analysts and commentators have busy schedules over the winter going from meeting to meeting, conference to conference, with absolutely nothing to talk about. There are two paths through the yellow woods to choose from: The one more frequently taken is to fill time and collect checks regurgitating USDA numbers. The path less traveled is to talk about the ebb and flow of markets over the coming quarter based on seasonal analysis. That’s the one I took, usually, and it has made all the difference.
With this in mind, let’s take a quick look at some of the key markets we track and what tends to happen over the course of the winter.

As usual, I’ll start with Corn, and to do so, I’ll focus on the market’s intrinsic value, the National Corn Index ($CNCI). A look at the Indexes seasonal patterns show it has a 10-year tendency to gain 4% from the last weekly close of November through the last weekly close of February, with the 5-year study showing a gain of 5% during the winter quarter. Given the Index was priced near $4.02 on Friday, November 28, the target range for the last weekly close of winter is between $4.18 (10-year) and $4.22 (5-year). Since we know Corn has a characteristic Round Number Reliance, let’s call the target $4.20. Last year, with a similar market structure, the Index gained 5% as it rallied from an end of November figure of $4.07 to a February final price of $4.27.

Over in Soybeans, the seasonal pattern gets more interesting as winter in North America means it is summer in South America. In other words, the key quarter for Brazil’s next crop meaning the world’s largest buyer (China, if you needed a hint) keeps a close eye on its largest supplier (Brazil, naturally). The US, as a secondary player in the global soybean market post 2018 social media trade war, tends to ship 77% of total exports through the end of February, the first half of the marketing year. As for the National Soybean Index ($CNSI), it tends to gain between 5% (5-year) and 7% (10-year) during the winter quarter. The Index was priced near $10.64 the last weekly close of November putting the target range between $11.17 and $11.38.
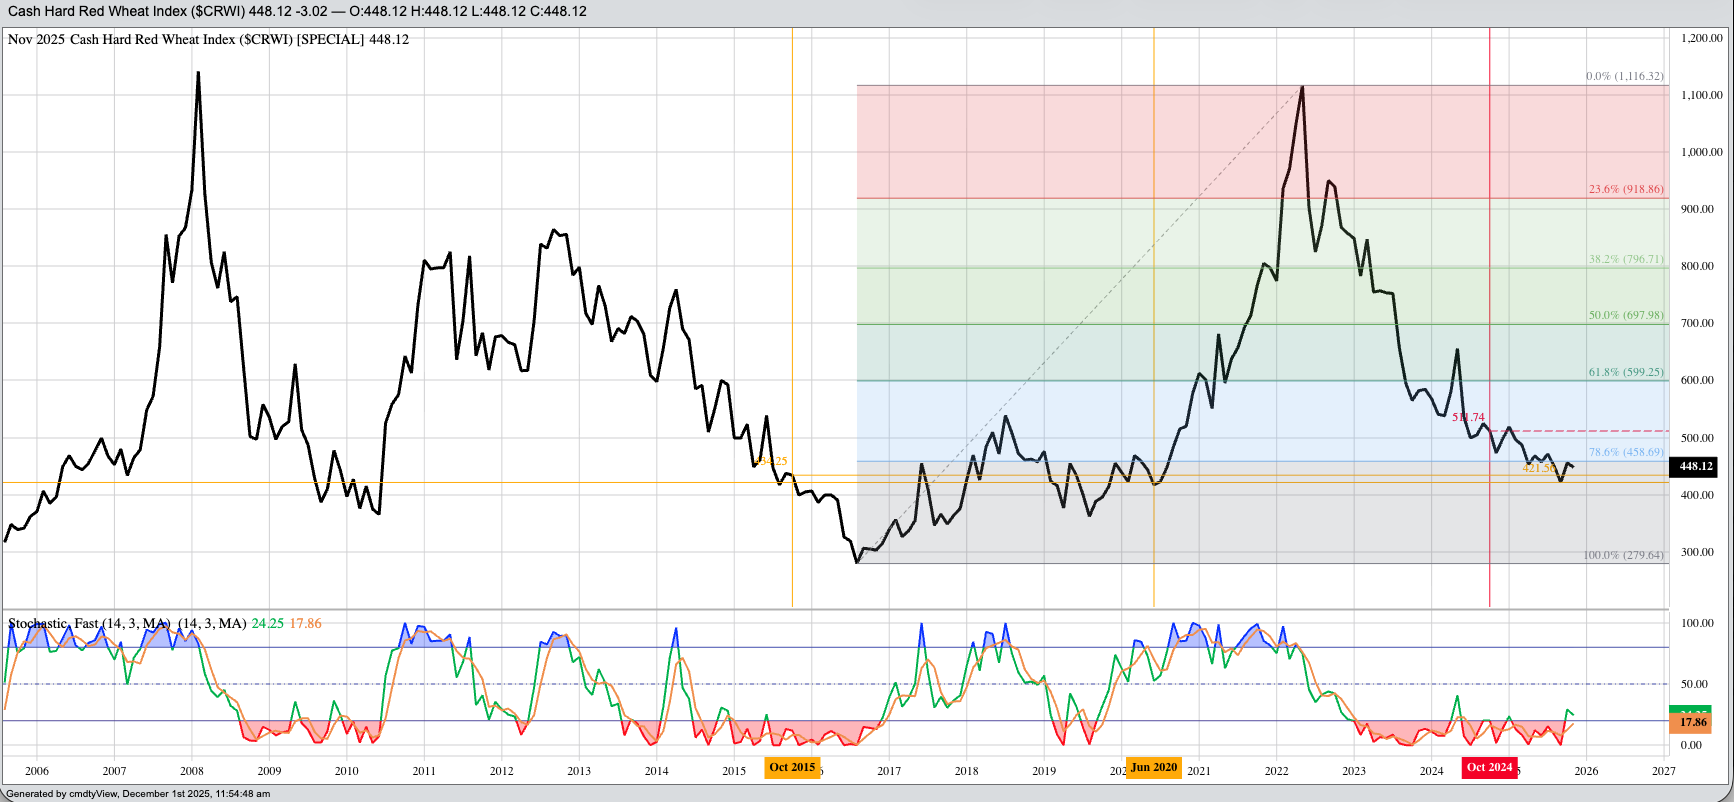
When it comes to Wheat, we have a couple things to keep in mind: First, HRW is the largest class grown in the United States, so I’ll focus on that market’s seasonal studies. Second, the characteristic Krampus Countdown that tells us not to be long wheat in December. The National HRW Index ($CRWI) shows a seasonal tendency to weaken during the winter quarter, but not by much. The 5-year seasonal study shows a loss of 1% while the 10-year is down 2%. With the Index priced at $4.48 as November came to an end, the target for the last weekly close of February is between $4.43 and $4.39. I know that doesn’t seem like much, but keep in mind commercial storage is roughly 8.0 cents per bushel per month and the winter woes worsen.
There is more to talk about, but I have all winter to do it. But for now, it’s time to bring this piece to a close so I can go outside and shovel snow. When I return, I will look again at what day Spring Training Season starts for the Kansas City Royals.
On the date of publication, Darin Newsom did not have (either directly or indirectly) positions in any of the securities mentioned in this article. All information and data in this article is solely for informational purposes. For more information please view the Barchart Disclosure Policy here.
More news from Barchart