In a year filled with strange and wild stock action, I’ll nominate Oracle’s (ORCL) as among the very weirdest.
I wrote about ORCL back on Sept. 12, following the stock’s giant move of more than 35% in a single trading day. For a stock already among the S&P 500 Index’s ($SPX) biggest, that was a move to behold. It occurred after a pair of very pivotal new business announcements.
However, if there’s anything that characterizes 2025’s market, it is this: Announcements are one thing, cash delivered as earned revenue is another. This year has been filled with feel-good deals. My suspicion is that in 2026, the bar for turning words into cash will be raised. A lot.
ORCL’s price action since that remarkable event 3 months ago is depicted in its chart here. I’ve tried to point it out using those purple arrows. The stock was in a brief downtrend in early September. So the announcement that followed not only caught the market off guard, it made recapping it on a technical chart more like digging deep into your pocket to find something you’re missing.
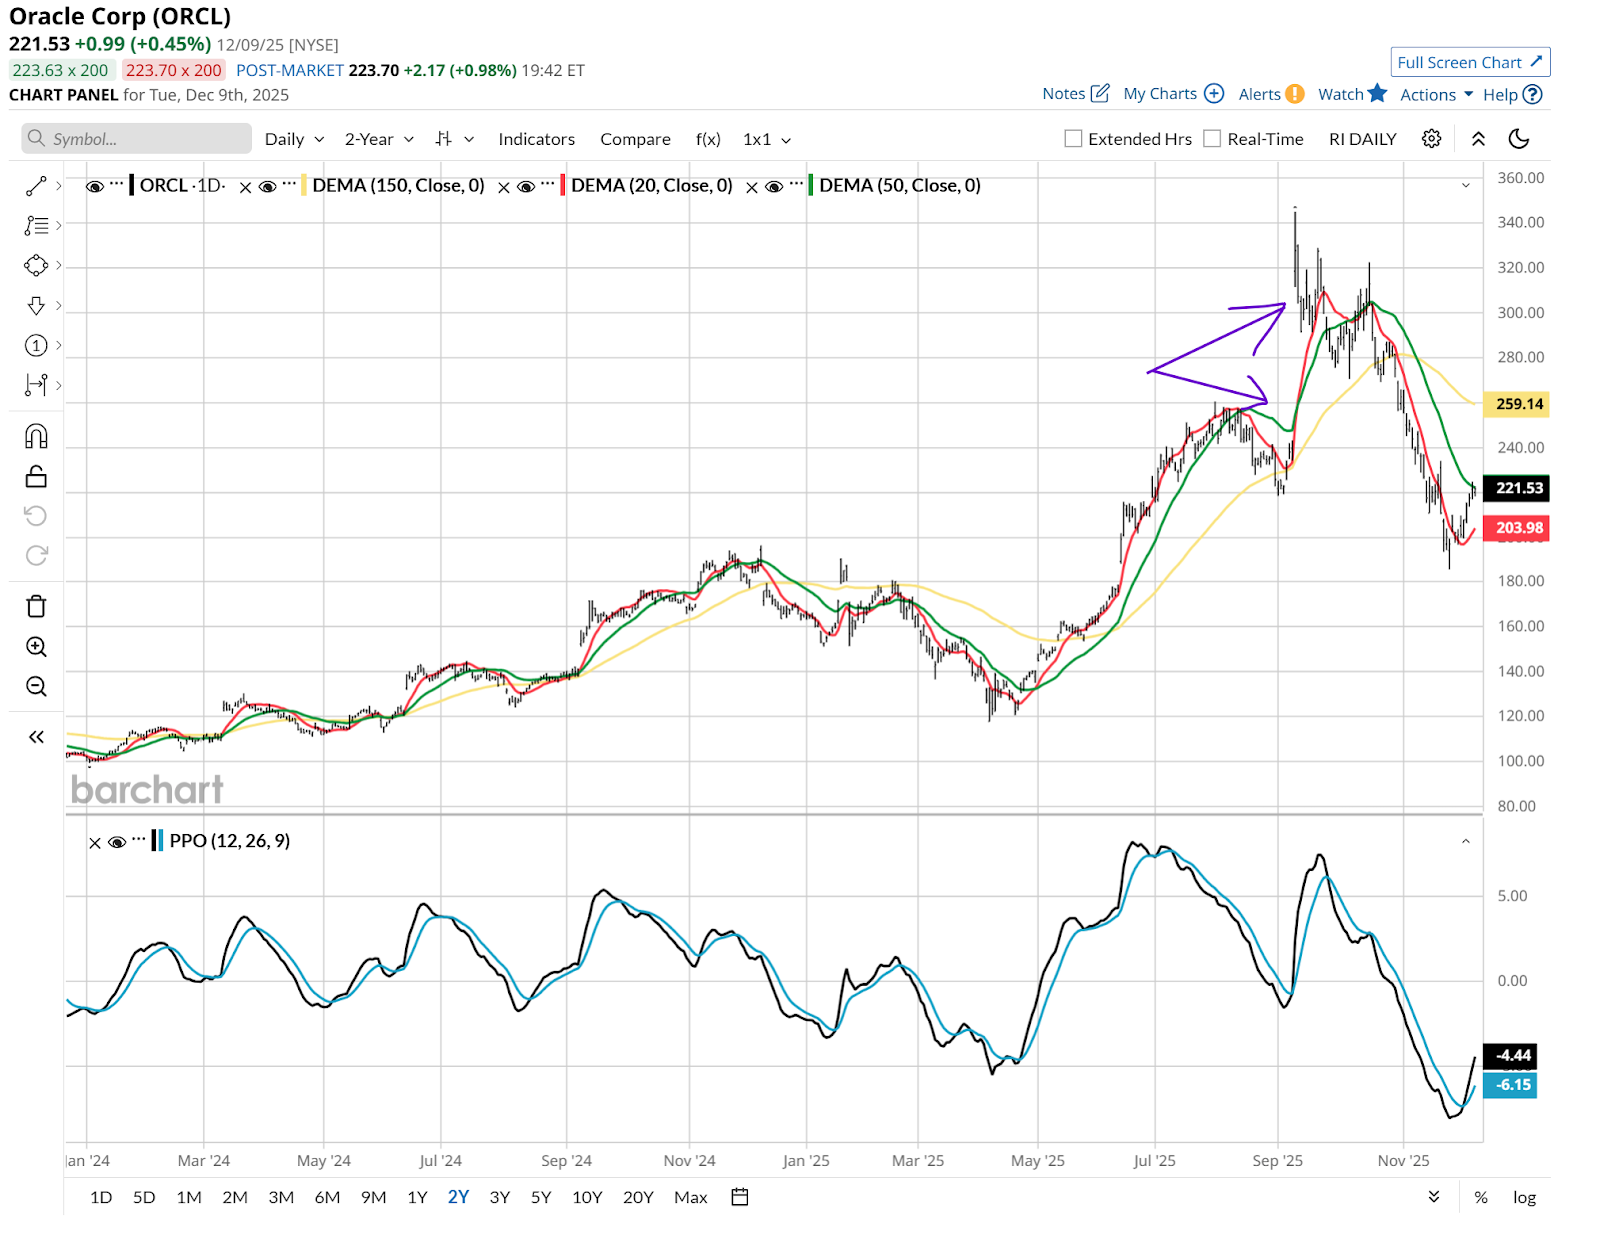
ORCL didn’t miss that day. But what followed was quite, well, weird. The stock price gyrated in a way that would make Shakira or the late great James Brown jealous.
The tale of the tape: $220 to north of $340, then a retreat to under $190. All in under 3 months! So, what’s next?
Analyst estimates are shown here. Earnings per share jumped 91% in its fiscal Q2, reported Wednesday. And the Street expects the company to continue to grow double digits.
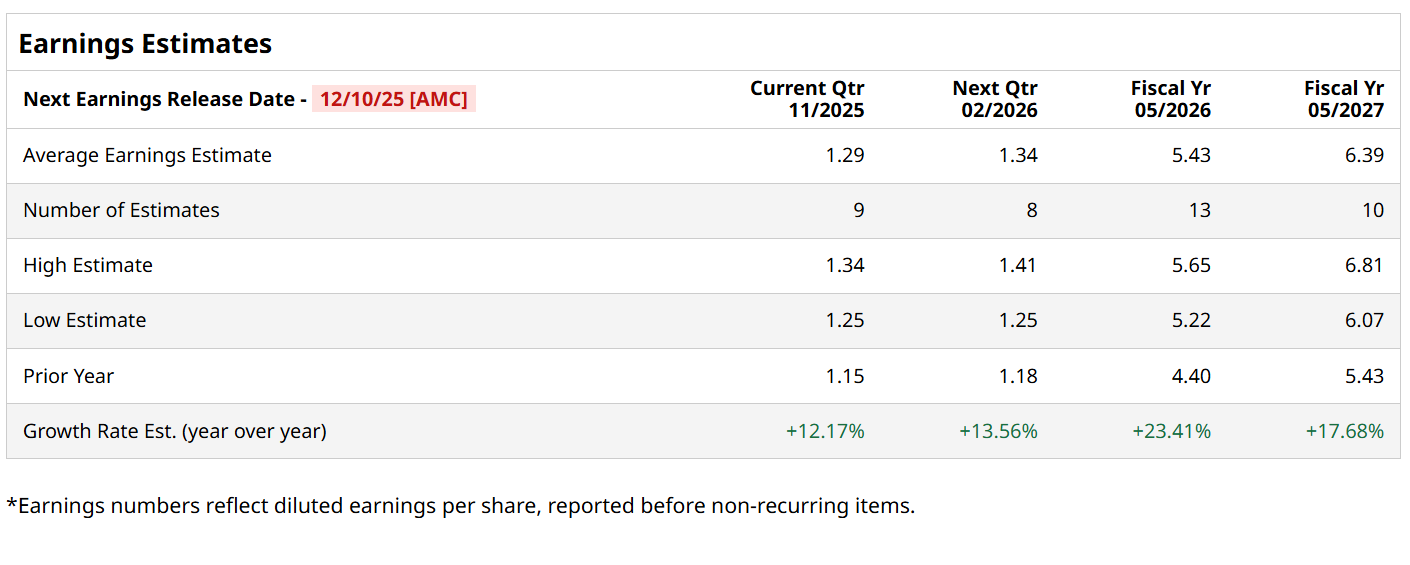
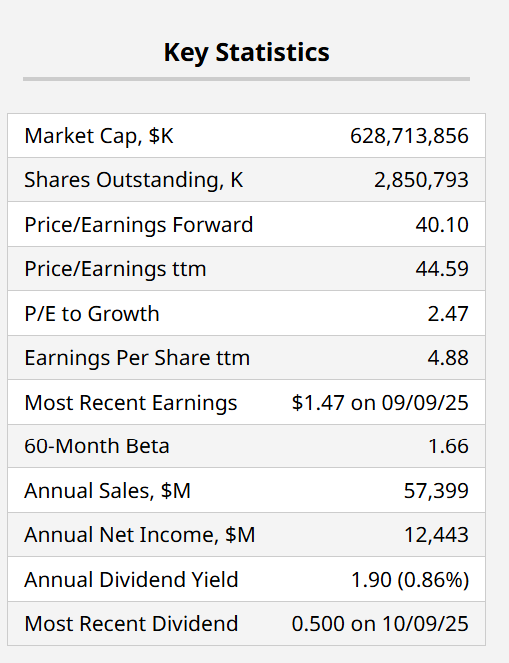
And following that price movement, ORCL has settled back into a 40x trailing price-earnings ratio. That sounds high, but at under 2.5x its growth rate, it is well within the range of what this AI-driven market has been rewarding.
I Showed You a Collar in September. Now What?
Let’s look back at the sample trade I included in that previous article. Here it is.
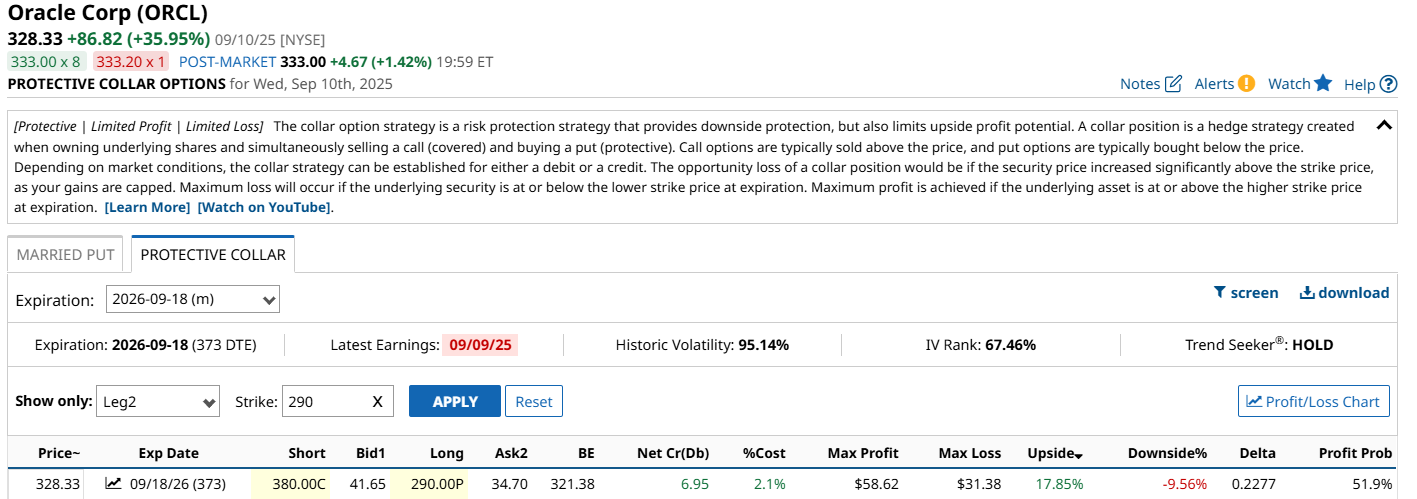
A summary: that collar went out about a year (now 9 months), with call and put strikes at $380 and $290, respectively. That produced a sensational upside to downside of roughly +18% to under -1%. That’s how we try to take advantage of volatility around such events, while managing risk.
It is one thing for me to outline a collar at the time. It is another to look back and see something like this: Imagine if you had a put struck at $290 with ORCL stock at $328, only to see it sitting at $221 as of Tuesday’s close. That put option was…wait for it…more than $68 in the money. THAT is risk management. And most likely, a holder of that put option would have exercised it by now, and sold ORCL for $290, even as it languished down here.
When I refresh the collar scenarios to today, here’s one of many ways to play it. $290 is now the call strike, not the put. That’s struck around the current level at $220. I went out to the same Sept. 18, 2026 expiration date, simply to show that one could have sold the stock at $290 via exercising the put there a while back, exited that previous collar with capital intact, and now entered way down here.
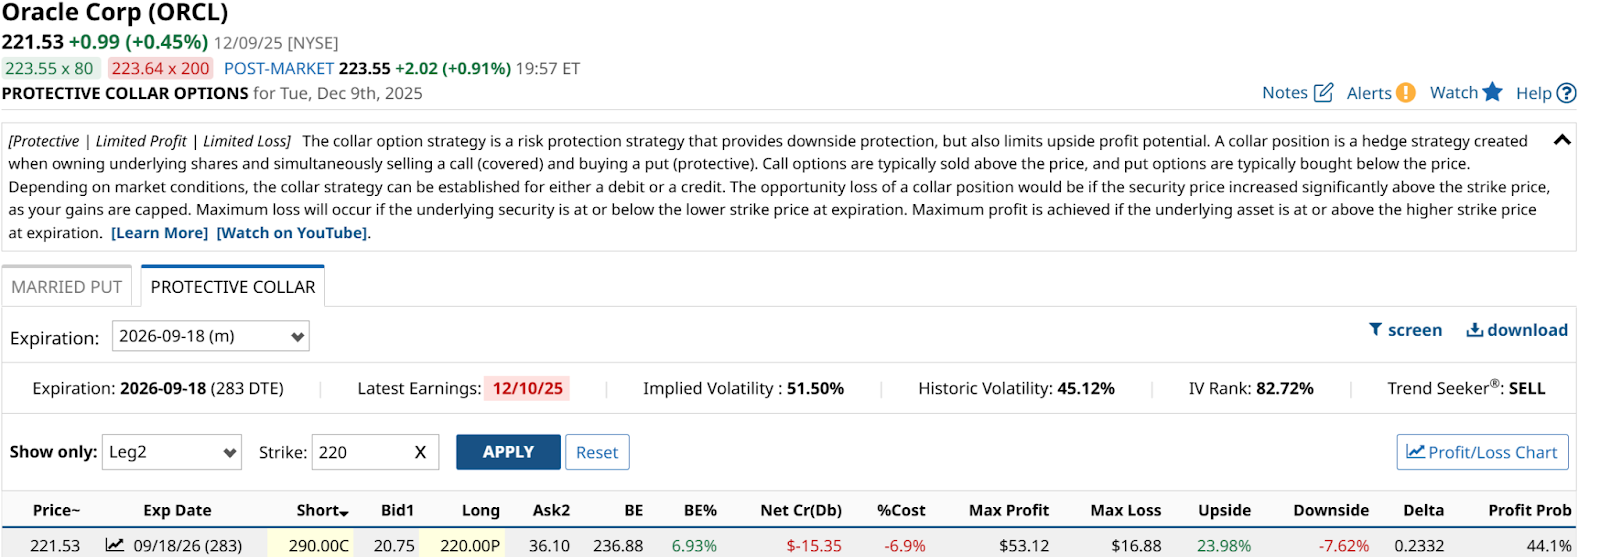
That $290 upside used is really just a coincidence. Because the new journey starts here, and the nearly $70 loss in between would never have been endured.
This produces about a 24% upside potential and under 8% downside, so more than a 3:1 ratio over the next 10 months for ORCL stock. As I see it, there might be no weirder stock in 2025. And no more shining example of the value of considering option collars than this one.
On the date of publication, Rob Isbitts did not have (either directly or indirectly) positions in any of the securities mentioned in this article. All information and data in this article is solely for informational purposes. For more information please view the Barchart Disclosure Policy here.
More news from Barchart
- Carvana Stock Is Joining the S&P 500. Should You Buy Shares Now?
- AeroVironment Is Supposed to Be the Next Palantir, But Its Earnings Disappointed in Q2. How Should You Play AVAV Stock?
- How Fast Does an AI Chip Depreciate, and Why Does It Matter for Nvidia Stock?
- Avocado and AI: How Would a New Model from Meta Platforms Influence the Bull and Bear Cases for META Stock?