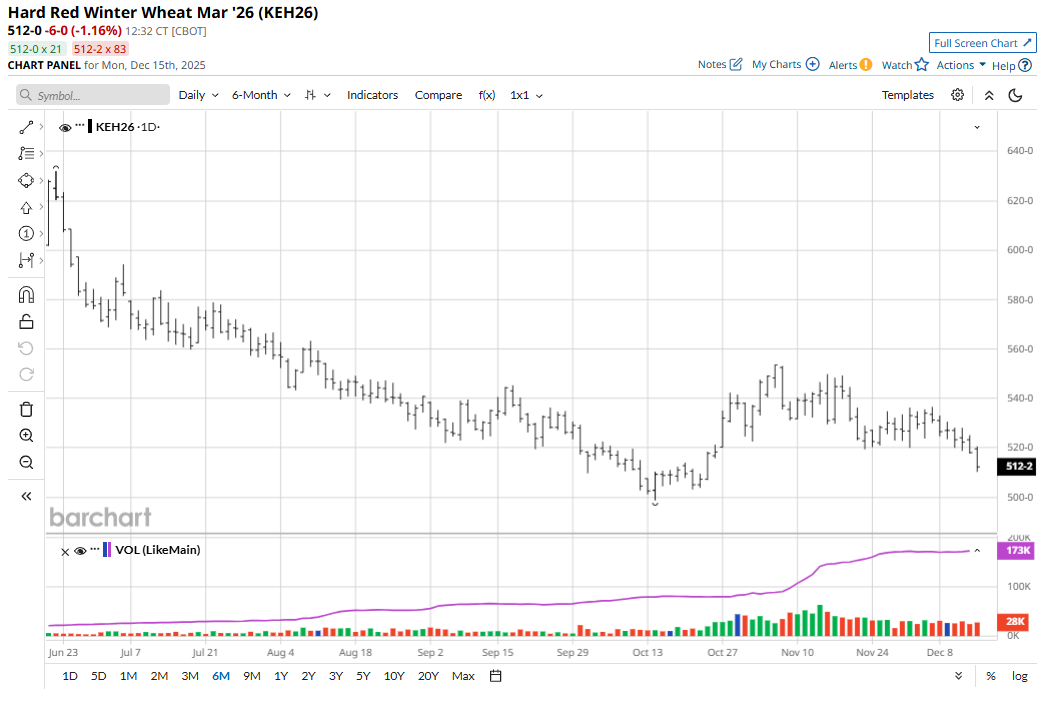
March corn (ZCH26) futures hit a two-week low on Friday and fell 5 3/4 cents to $4.40 3/4, and on the week dropped 4 cents. January soybeans (ZSF26) on Friday fell 16 3/4 cents to $10.76 3/4, hit a six-week low, and for the week were down 29 1/4 cents. March soft red winter wheat (ZWH26) fell 4 1/4 cents to $5.29 1/4 and closed at a six-week-low close. For the week, March SRW was down 7 1/4 cents. March hard red winter wheat (KEH26) on Friday fell 4 1/4 cents to $5.18, hit a six-week low, and lost 13 1/4 cents on the week. Importantly, all the above markets on Friday closed at technically bearish weekly low closes, suggesting the speculative, chart-based bears have a head of steam early this week to continue to more aggressively play the short sides of the grain markets.
Corn Remains in Choppy Trading Range
March corn futures remain in the middle of a choppy and sideways trading range, but Friday’s price action gave the bears momentum. Bulls got no help from the USDA reporting daily U.S. corn sales of 250,000 MT of corn to unknown destinations during 2025-26 on Friday. Export demand for U.S. corn has been good. USDA in last week’s supply and demand report (WASDE) gave a 125-million-bushel boost to U.S. corn exports for the 2025-26 marketing year. While corn futures prices have languished the past few weeks, the hefty U.S. corn sales abroad should keep a floor under futures prices.
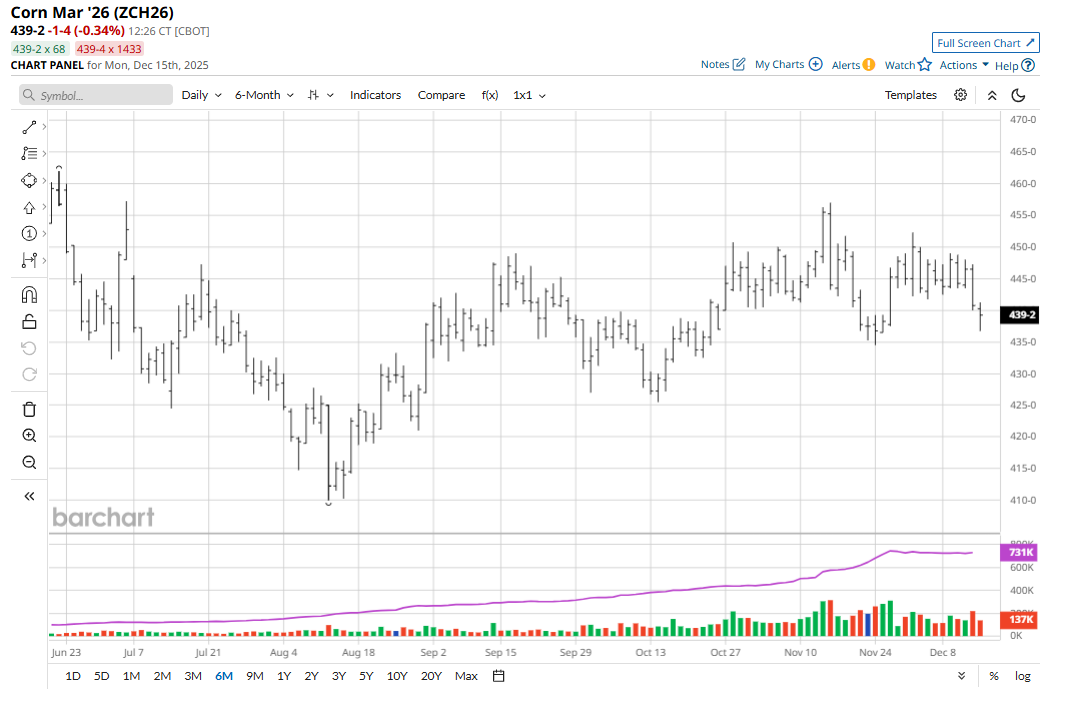
The U.S. government took a break from reporting row-crop production in December but will be back in January. The U.S. corn production estimate may be the most closely scrutinized figure when the January USDA data comes out.
Soybean Prices Are Trapped in a Downtrend
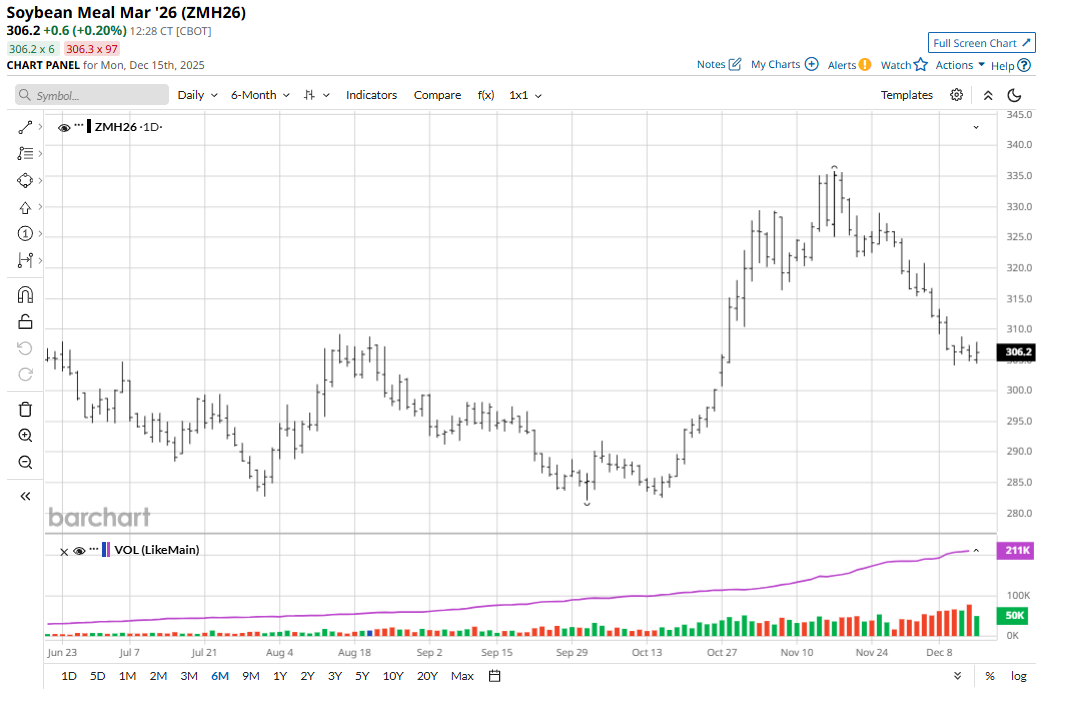
January soybeans are presently in a three-week-old price downtrend on the daily bar chart. That’s keeping the speculator bears confident that prices will continue to trade sideways to lower in the near term. Recent U.S. soybean sales to China, as reported by the USDA, have not been that supportive for soy complex futures prices because that news has already been factored into prices following the U.S.-China trade truce several weeks ago that outlined more China purchases of U.S. soybeans. In fact, soy traders are a bit concerned China has not bought more U.S. soybeans. The one positive element for soybeans is the fact that soybean meal (ZMF26) futures on Friday held near steady, while beans suffered a solid selloff.
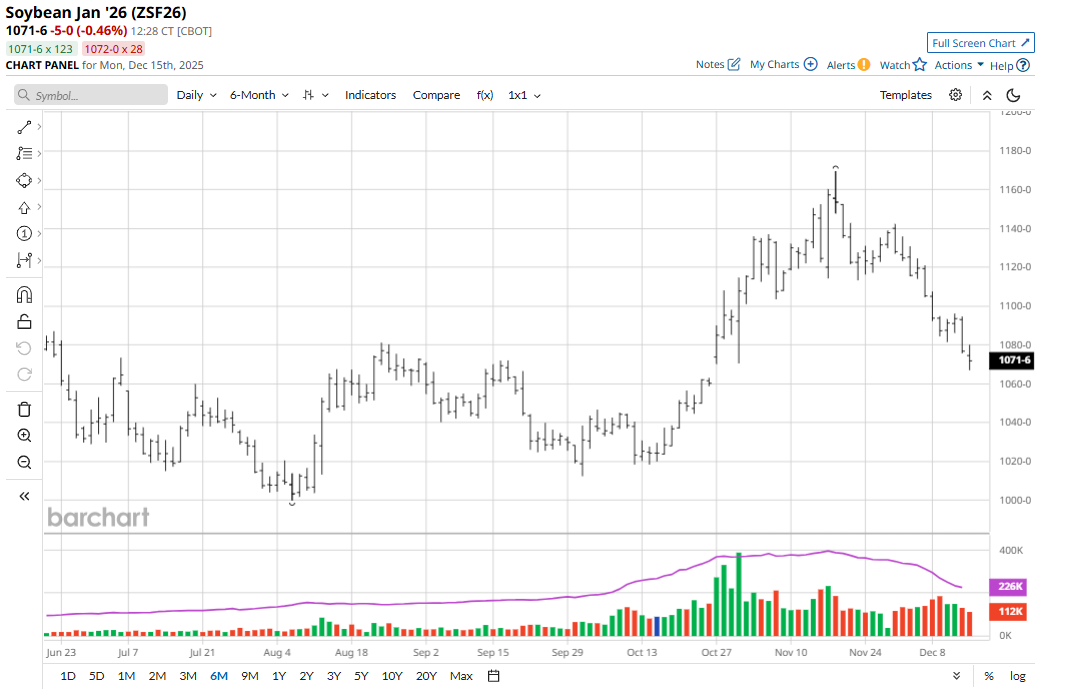
Soy complex traders will closely examine the monthly NOPA crush report that is due out today at 11:00 a.m. CST.
Soybean and corn traders are more closely watching weather conditions in South American soybean-growing regions. There are some dry pockets in Argentina corn and bean regions, which the bulls are watching closely.
Wheat Market Bears in Firm Control
The winter wheat futures markets remain trapped in price downtrends on the daily bar charts. Ample global supplies continue to hang over the wheat markets. Argentina’s Rosario exchange late last week raised its 2025-26 wheat production estimate by 2.2 million metric tons (MMT), to a record 27.7 MMT. The Buenos Aires Grain Exchange estimates Argentine wheat production at 25.5 MMT, while USDA’s latest estimate is 24 MMT. Russia’s seaborne grain exports rose in November for the first time this season to 6.0 MMT, up 26.6% from the same month a year-ago, according to shipping data from industry sources.
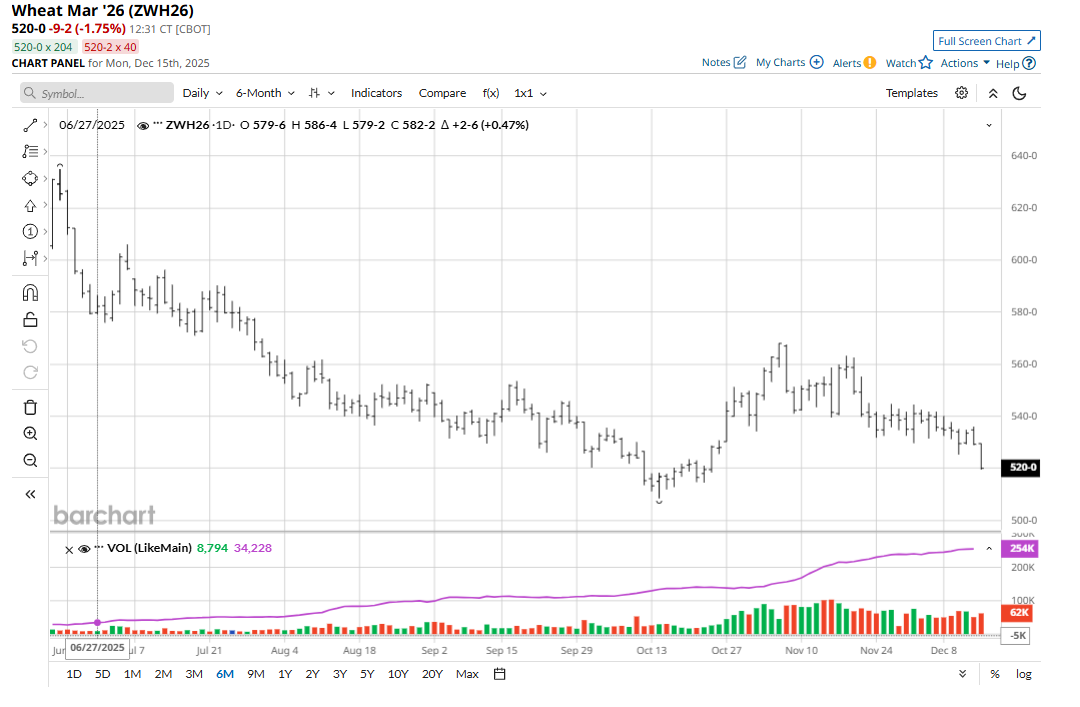
The ongoing Russia-Ukraine peace talks have not yet yielded a ceasefire between the two warring nations. President Donald Trump said late last week that he is still pressing both countries to agree to a ceasefire. While there have been reports of some progress being made, most agree that a lasting ceasefire remains very elusive. Wheat traders will continue to monitor this situation. A ceasefire would imply more wheat supplies being shipped out of the Black Sea region in the coming months.
Cotton Futures Languish Near Recent Contract Low
March cotton (CTH26) futures on Friday fell 14 points to 63.83 cents and for the week lost 10 points. Cotton’s solidly bearish near-term technical posture continues to limit buying interest from the speculators. Cotton traders will look to the grain futures markets for price direction this week. And the grain futures markets are looking very heavy at present.
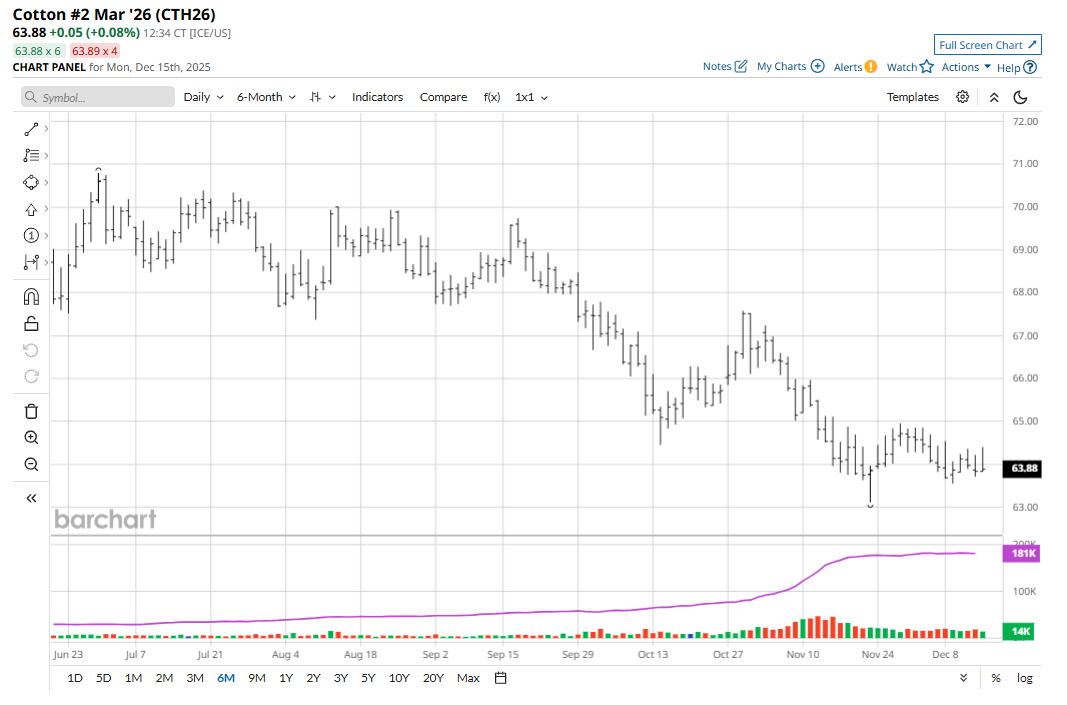
Last week, the USDA bumped up the average U.S. cotton yield by 10 lbs., which led to a slightly higher-than-expected U.S. production estimate despite harvest area remaining unchanged. Combined with a 100,000-bale cut to domestic use, and that will likely continue to pressure cotton futures prices well into the new year.
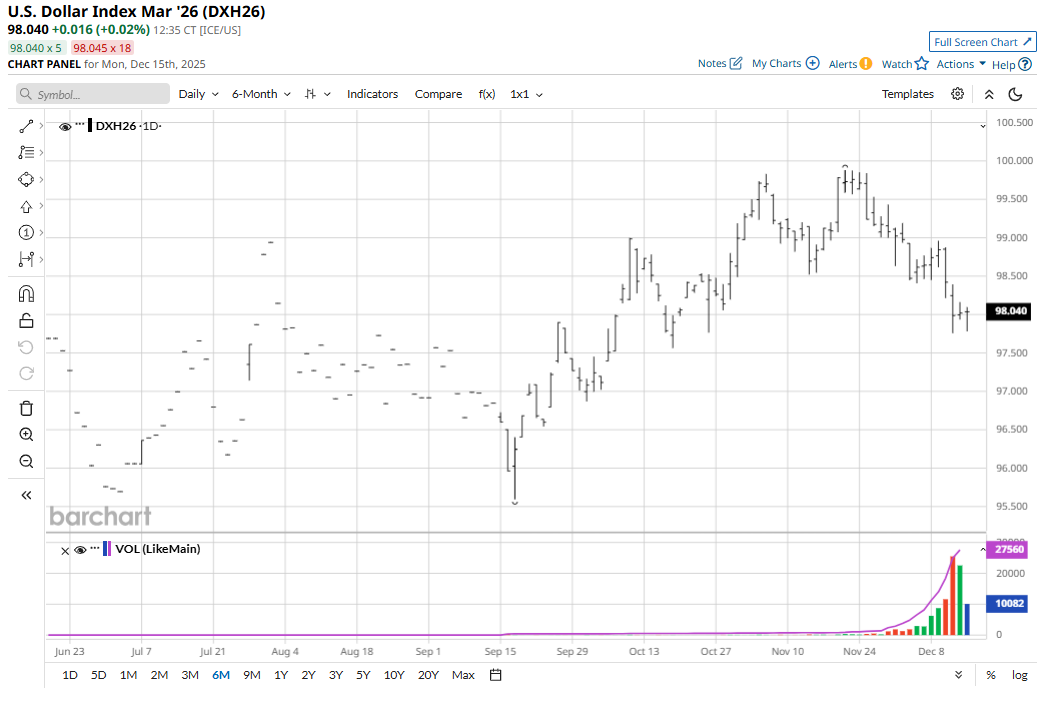
Depreciating Greenback Is a Positive for Grains, Cotton Prices
One price-positive element for the grain and cotton futures markets recently has been the depreciation of the U.S. dollar ($DXY) on the foreign exchange market — making U.S. ag products less expensive to purchase in non-U.S. currency. Trends in the currency markets tend to last longer than trends in other markets. That suggests the weaker greenback could remain a positive fundamental for the grains and cotton in the next few months.
Tell me what you think. I really enjoy getting emails from my valued Barchart readers all over the world. Email me at jim@jimwyckoff.com.
On the date of publication, Jim Wyckoff did not have (either directly or indirectly) positions in any of the securities mentioned in this article. All information and data in this article is solely for informational purposes. For more information please view the Barchart Disclosure Policy here.