With a market cap of $139.3 billion, Capital One Financial Corporation (COF) is a financial services holding company that oversees Capital One, National Association, offering a wide range of financial products and services across the U.S., Canada, and the U.K. It operates through three main segments: Credit Card, Consumer Banking, and Commercial Banking, providing deposit accounts, loan products, and advisory and treasury services.
Companies valued at $10 billion or more are generally classified as “large-cap” stocks, and Capital One Financial fits this criterion. It serves consumers, small businesses, and commercial clients through digital platforms, branches, cafés, and other channels.
Shares of the McLean, Virginia-based company have fallen 5.2% from its 52-week high of $232.45. Capital One Financial’s shares have decreased 3% over the past three months, underperforming the broader S&P 500 Index’s ($SPX) 5.5% gain over the same time frame.
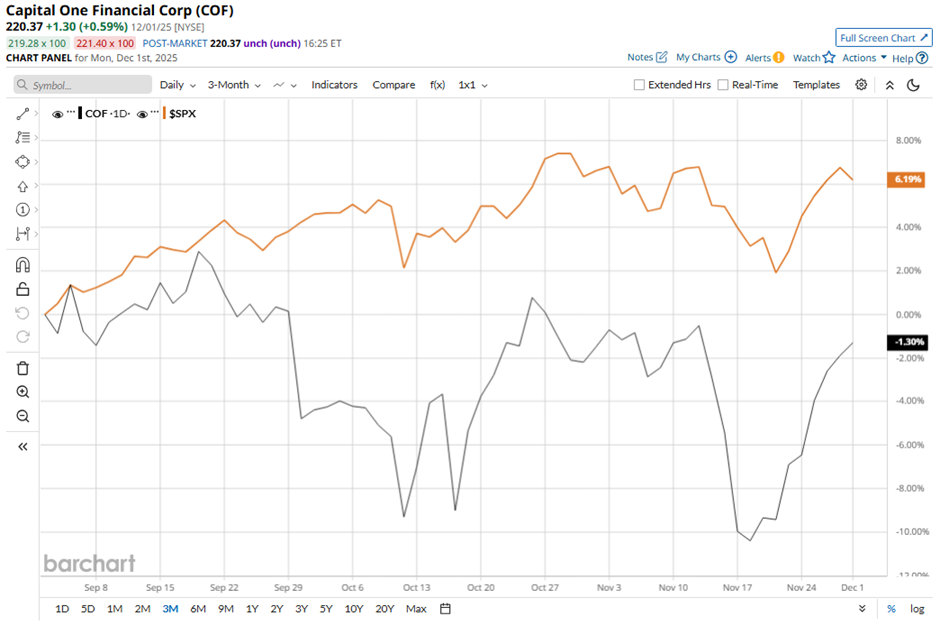
In the longer term, COF stock has surged 23.6% on a YTD basis, outpacing SPX’s 15.8% rise. Moreover, shares of the credit card issuer and bank have soared 14.8% over the past 52 weeks, compared to the 12.9% return of the SPX over the same time frame.
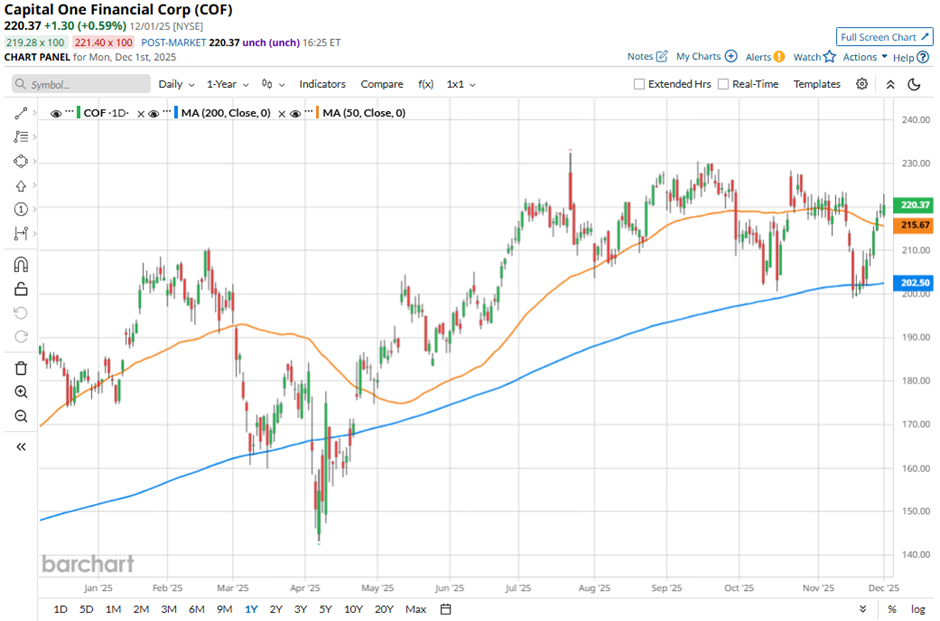
Despite a few fluctuations, the stock has been trading mostly above its 50-day and 200-day moving averages since last year.
Shares of COF rose 1.5% following its Q3 2025 results on Oct. 21, with adjusted EPS of $5.95, far above analysts’ estimate and sharply improved from the prior quarter’s loss. Investors also reacted positively to the 23% increase in total net revenue to $15.4 billion, strong pre-provision earnings growth of 29%, and a sharp drop in the provision for credit losses to $2.7 billion, including a $760 million reserve release.
Additionally, management highlighted solid operating metrics such as an improved 8.36% net interest margin and noted that the Discover integration is progressing well.
In comparison, rival Visa Inc. (V) has lagged behind COF stock. Visa stock has gained 4.5% on a YTD basis and 4.9% over the past 52 weeks.
Due to the stock’s strong performance over the past year, analysts remain bullish on COF. The stock has a consensus rating of “Strong Buy” from the 23 analysts in coverage, and the mean price target of $263.27 is a premium of 19.5% to current levels.
On the date of publication, Sohini Mondal did not have (either directly or indirectly) positions in any of the securities mentioned in this article. All information and data in this article is solely for informational purposes. For more information please view the Barchart Disclosure Policy here.
More news from Barchart
- This Options Strategy Turns Your Stock Portfolio Into a Consistent Income Generator
- This ‘Strong Buy’ Dividend Stock Looks Set to Raise Payouts. Should You Buy Shares Now?
- JPMorgan Just Upgraded CleanSpark Stock. Should You Buy Shares Here?
- Dear Walmart Stock Fans, Mark Your Calendars for December 9