Houston, Texas-based Kinder Morgan, Inc. (KMI) is an energy infrastructure company that operates an extensive network of pipelines and terminals that transport and store natural gas, refined petroleum products, crude oil, carbon dioxide (CO₂), and other energy commodities. It is valued at a market cap of $60.7 billion.
Companies worth $10 billion or more are typically classified as “large-cap stocks,” and KMI fits the label perfectly, with its market cap exceeding this threshold, underscoring its size, influence, and dominance within the oil & gas midstream industry. With a focus on stable cash flows, disciplined capital allocation, and growing investment in low-carbon opportunities such as renewable natural gas and CO₂ transport for carbon capture, the company remains a key player in North America’s midstream energy sector.
This energy company is currently trading 14.7% below its 52-week high of $31.48, reached on Jan. 21. Shares of KMI have gained marginally over the past three months, underperforming the Nasdaq Composite’s ($NASX) 10% rise during the same time frame.
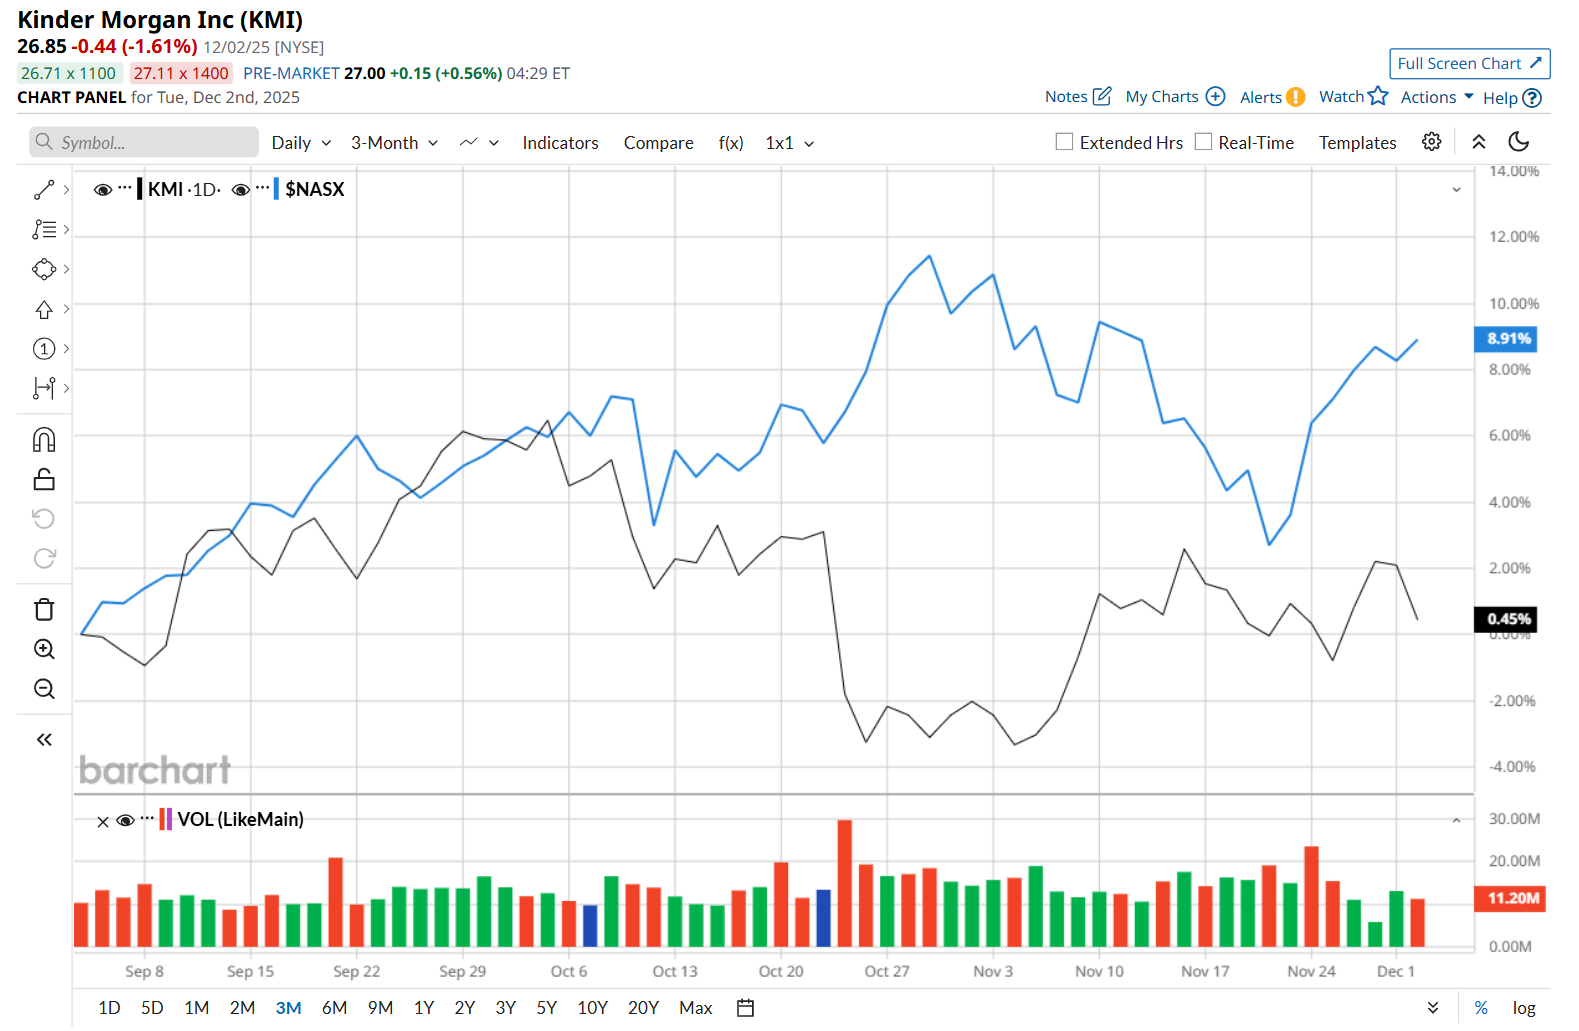
Moreover, on a YTD basis, shares of KMI are down 2%, compared to NASX’s 21.3% return. In the longer term, KMI has declined 2.2% over the past 52 weeks, considerably trailing NASX’s 20.7% uptick over the same time frame.
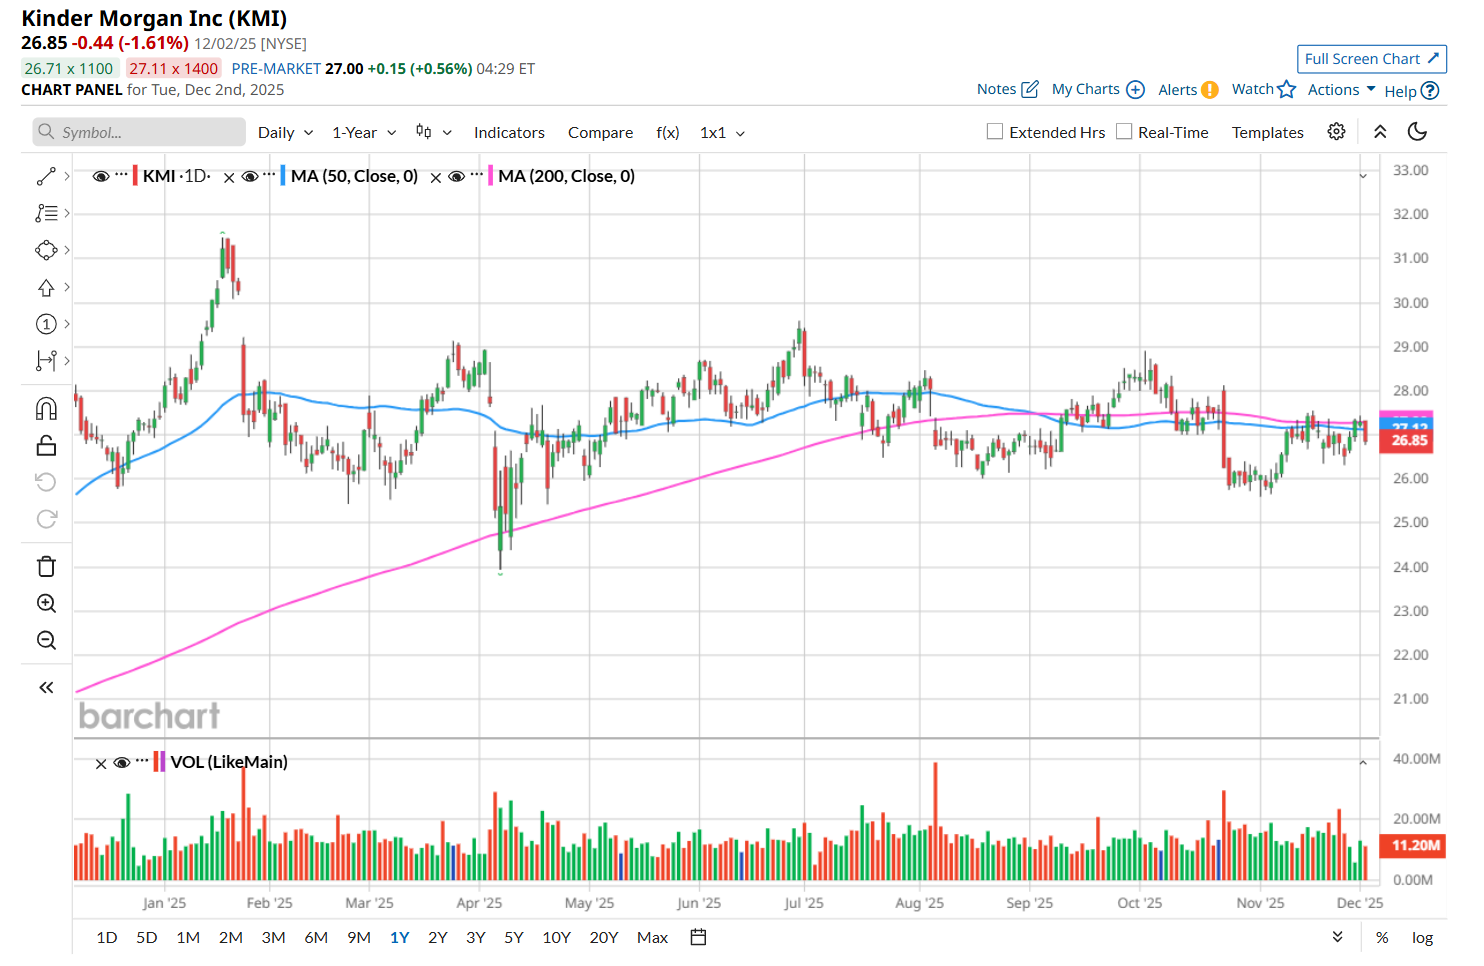
To confirm its bearish trend, KMI has been trading below its 200-day moving average since early October, with slight fluctuations, and has remained below its 50-day moving average since late October, with minor fluctuations.
On Oct. 22, KMI released its Q3 results. The company's total revenue increased 12.1% year over year to $4.1 billion, and adjusted EPS climbed 16% from the same period last year to $0.29, meeting analyst estimates. Moreover, its adjusted EBITDA also improved 5.9% from the year-ago quarter to $2 billion. Yet, its shares plunged 4.8% in the following trading session.
KMI has also underperformed its rival, Enbridge Inc. (ENB), which gained 11% over the past 52 weeks and 13.4% on a YTD basis.
Despite KMI’s recent underperformance, analysts remain moderately optimistic about its prospects. The stock has a consensus rating of "Moderate Buy” from the 20 analysts covering it, and the mean price target of $31.84 suggests an 18.6% premium to its current price levels.
On the date of publication, Neharika Jain did not have (either directly or indirectly) positions in any of the securities mentioned in this article. All information and data in this article is solely for informational purposes. For more information please view the Barchart Disclosure Policy here.
More news from Barchart
- Small-Cap Investment Firm Slumps to 52-Week Low: Opportunity or Red Flag?
- IonQ Wants to Bring Quantum Computing to Medicine. Should You Buy IONQ Stock Here?
- Jamie Dimon Once Called Bitcoin a ‘Fraud.’ Now, JPMorgan Is Quietly Making Blockchain History and Betting This ‘Crypto Winter’ Will Be Short-Lived.
- Down 41% From Its Highs, Should You Buy the Dip in MP Materials Stock?