Constellation Energy Corporation (CEG), headquartered in Baltimore, Maryland, operates as a leading energy provider. The company manages an extensive network of power generation facilities, encompassing nuclear, natural gas, wind, solar, and hydroelectric plants.
Its core operations involve producing and supplying reliable electricity and natural gas to commercial, industrial, and residential customers nationwide. From its Maryland base, Constellation oversees fleet management, energy trading, and delivery services to ensure consistent power availability. The company has a market capitalization of $119.71 billion.
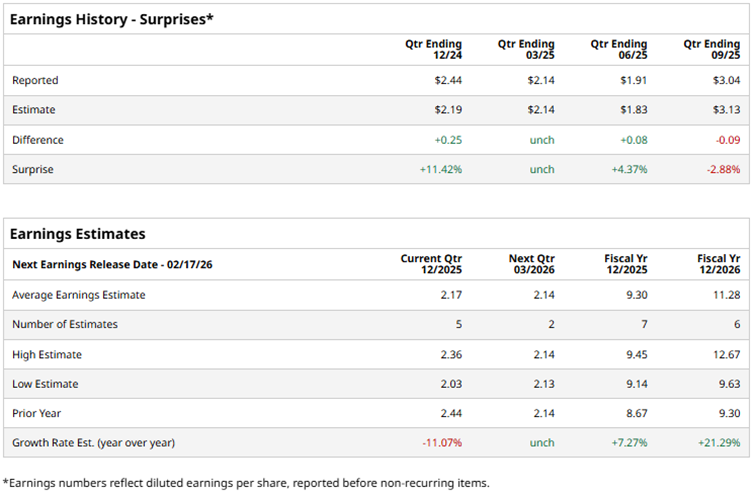
Constellation is set to report its fourth-quarter results for fiscal 2025 soon. Ahead of the results, Wall Street analysts expect the company to report a profit of $2.17 per diluted share for Q4, down 11.1% year-over-year (YOY). The company has topped EPS estimates in two out of the four trailing quarters. For the full fiscal year 2025, Wall Street analysts expect CEG’s diluted EPS to increase by 7.3% annually to $9.30, followed by a 21.3% YOY improvement to $11.28 in fiscal 2026.
CEG’s stock has benefited from the company’s position as the leading U.S. nuclear power operator, as surging demand for reliable, carbon-free energy to support artificial intelligence (AI) data centers and electrification trends has driven gains. However, the stock’s gains have been capped by its volatility.
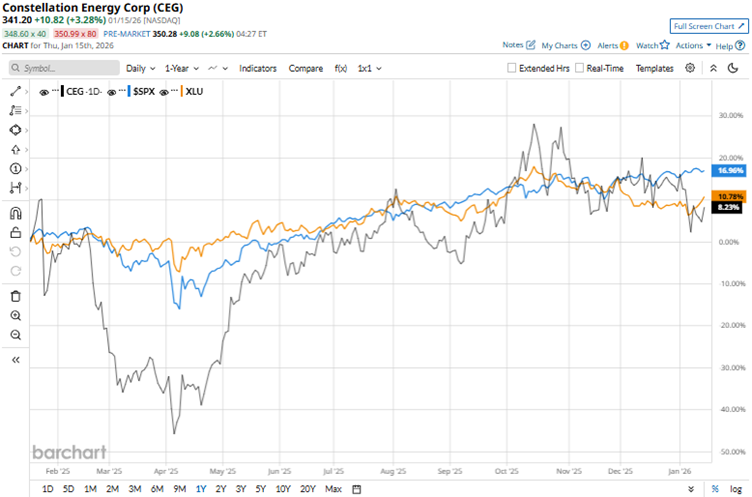
Over the past 52 weeks, Constellation’s stock has gained 13.4%, while it has gained 7.3% over the past six months. On the other hand, the broader S&P 500 Index ($SPX) has increased by 16.7% and 11.2% over the same periods, respectively. Therefore, CEG has underperformed the broader market over the past year.
Next, we compare the stock’s performance with that of its own sector. The State Street Utilities Select Sector SPDR ETF (XLU) has gained 13.6% over the past 52 weeks and 6.4% over the past six months. Therefore, while CEG has marginally underperformed its sector over the past year, it has modestly outperformed over the past six months.
Two key developments shape Constellation Energy's outlook for this year. First, in November last year, the company secured a $1 billion U.S. Department of Energy (DOE) loan to support its Crane Clean Energy Center. Second, this year Constellation received U.S. Nuclear Regulatory Commission (NRC) approval for a License Amendment Request for the Limerick Clean Energy Center’s Digital Modernization Project, which is expected to enhance its diagnostic capabilities and cyber resilience.
On Nov. 7, Constellation reported third-quarter results for fiscal 2025, showing growth in its bottom line. The company’s nuclear fleet, including its ownership share from the Salem and South Texas Project (STP) generating stations, generated 46,477 GWh, up from 45,510 GWh in the prior-year period. Its adjusted operating earnings were $3.04 per share, up 10.9% YOY. The stock gained 2% intraday on Nov. 7.
Wall Street analysts have been bullish about Constellation Energy’s future. Among the 18 analysts covering the stock, the consensus rating is “Moderate Buy.” The rating configuration is more bullish than it was a month ago, with 12 “Strong Buy” ratings now, up from 11. The ratings are rounded off by one “Moderate Buy” and five “Holds.” The mean price target of $412.65 implies a 20.9% upside from current levels, while the Street-high price target of $520 implies 52.4% upside.
On the date of publication, Anushka Dutta did not have (either directly or indirectly) positions in any of the securities mentioned in this article. All information and data in this article is solely for informational purposes. For more information please view the Barchart Disclosure Policy here.
More news from Barchart