Look around at what's powering the modern world right now:
- AI data centers springing up everywhere (don't believe me? Come to Northern Virginia)
- Electric grids are getting a massive overhaul
- Renewable energy projects are everywhere you turn
It's clear that copper is among the unsung heroes holding all this together. But here's the problem: even the most prominent producing countries, like Chile, which is pushing to ramp up output, just aren't keeping pace. Industry reports are pointing to a structural deficit kicking in hard from around 2029, where demand from all this tech and energy transition growth outruns what mines can deliver.
Is this a short-term blip? No, it's the new reality we're heading into.
Can the Largest Producer (Chile) Meet Demand?
Production Constraints: Based on 2025–2026 industry data, Chile is struggling to meet growing global demand due to a convergence of structural, environmental, and operational constraints, leading to short-term supply stagnation. While Chile remains the top producer (providing ~24% of global copper), it is facing a "looming supply squeeze" rather than acting as an immediate, flexible source of increased supply.
Chile's Constraints: Despite holding 19% of the world's reserves, Chile's output has faced challenges due to declining ore grades, water scarcity, and project delays. While new projects are coming online, the industry needs to bring new mines online at twice the rate of the last decade, a challenging goal.
New Mine Construction: While current spot prices have recently hovered around $11,000–$12,000 per ton, the high capital expenditure required for new projects, often exceeding $25,000–$30,000 per ton of annual production capacity, means that only higher, sustained prices justify new "greenfield" (untouched) mining developments.
Technical Picture
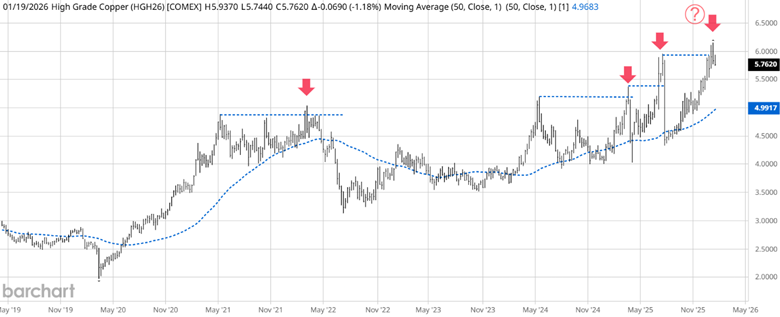
Source: Barchart
The bullish fundamentals we discussed above have been evident on the weekly continuous futures contract chart, showing a significant price rally off the last touch of the up-sloping 50-week moving average.
Copper has an interesting historical pattern that may temporarily derail this rally. The red arrows signify new all-time highs after breaking a previous all-time high. The historical pattern clearly shows that the copper market typically enters a significant price correction shortly after new all-time highs. Have we entered that period with the recent all-time high move?
Correlated Years
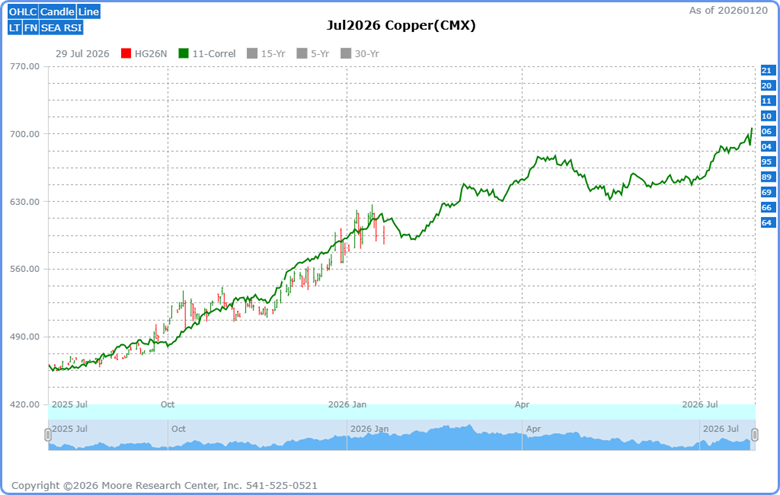
Source: Moore Research Center, Inc. (MRCI)
Source: MRCI
The July copper futures contract is currently experiencing a significant 11-year => 84% correlated pattern (green line). Additionally, there are four "almost" years, which equals 84%. The recent top in copper prices came near the peaking of the 11-year pattern. As prices correct from all-time highs, we will be looking to see whether the identified trough in correlated years at the end of January helps resume the bull market in copper.
Seasonal Pattern
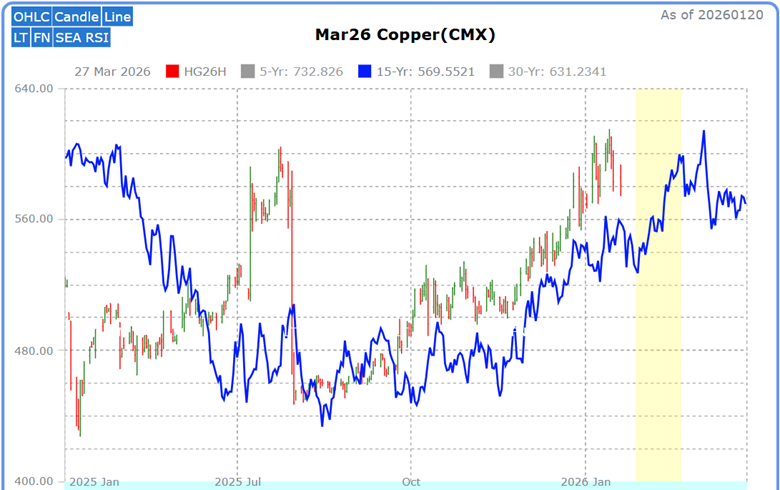
Source: MRCI
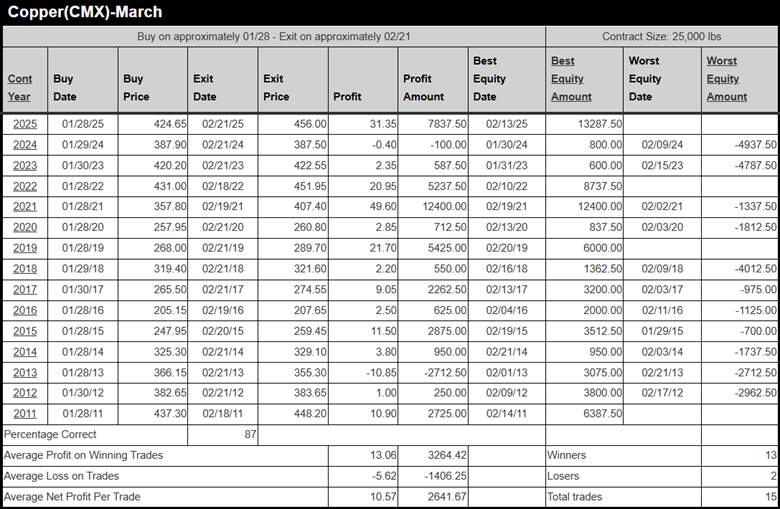
Interestingly, MRCI research has found an optimal seasonal buy window (yellow box) that begins near the same period as the correlated year's low. The seasonal pattern (blue line) shows that historically, the copper market has had a decent up move off the latter part of the January lows. During a hypothetical 15-year testing period, MRCI found that the March copper futures contract closed higher on February 21 than on January 28 in 13 of those 15 years, for an 87% occurrence. Keep in mind that optimal seasonal windows can begin or end a few days before or after an optimal date. In comparison, four of those years did not have a daily closing drawdown. During this testing period, the average net profit per contract was .1057, or $2,641.67.
As a crucial reminder, while seasonal patterns can provide valuable insights, they should not be the basis for trading decisions. Traders must consider various technical and fundamental indicators, risk management strategies, and market conditions to make informed, balanced trading decisions.
Source: MRCI
Assets to Trade the Copper Market
Traders can participate using these CME products:
- Standard Copper Futures (HG): Each contract represents 25,000 pounds of copper; each tick (0.0005 per pound) is $12.50 in US dollars. Ideal for institutional and experienced traders.
- Micro Copper Futures (QL): A reduced contract size of 2,500 pounds, with lower margin requirements, making it ideal for retail traders. Each tick (0.0005 per pound) is worth $1.25 per contract.
- Options on Copper Futures: Buy call options to profit from a price rise with limited risk, or sell put options to collect premiums if prices stay flat or rise.
In Closing…
Copper's story right now feels like one of those classic market setups where the fundamentals scream long-term shortage, driven by AI sucking down power, grids expanding, and renewables scaling up. While Chile, despite sitting on massive reserves and eyeing a bump in production this year, keeps bumping into real-world headaches like declining ore grades, water issues, and sky-high costs for new mines. Prices have cooled a bit from that wild January spike near $6 a pound (they're hanging around $5.75–$5.85 lately after hitting records), and yeah, those historical patterns and seasonal dips suggest we could see some more chop or even a pullback into late January before things potentially turn up again. But strip away the short-term noise, and the big picture hasn't changed, while demand looks set to keep outrunning supply as we head toward that 2029 structural deficit everyone's talking about. For traders eyeing HG futures, micros, or options, it's probably smart to stay nimble; copper can be unforgiving. Respect the technical signals and those correlated/seasonal windows—but don't lose sight of the underlying bull market. The copper shortage isn't going away anytime soon.
On the date of publication, Don Dawson did not have (either directly or indirectly) positions in any of the securities mentioned in this article. All information and data in this article is solely for informational purposes. For more information please view the Barchart Disclosure Policy here.
More news from Barchart