A long call butterfly is entered when a trader thinks a stock will not rise or fall by much between trade initiation and expiration. When using calls, the trade is constructed by buying an in-the-money call, selling two at-the-money calls and buying an out-of-the-money call. The trade is entered for a net debit meaning the trader pays to enter the trade. This debit is also the maximum possible loss.
The maximum profit is calculated as the difference between the short and long calls less the premium that you paid for the spread.
Let’s take a look at Barchart’s Long Call Butterfly Screener for February 11th:
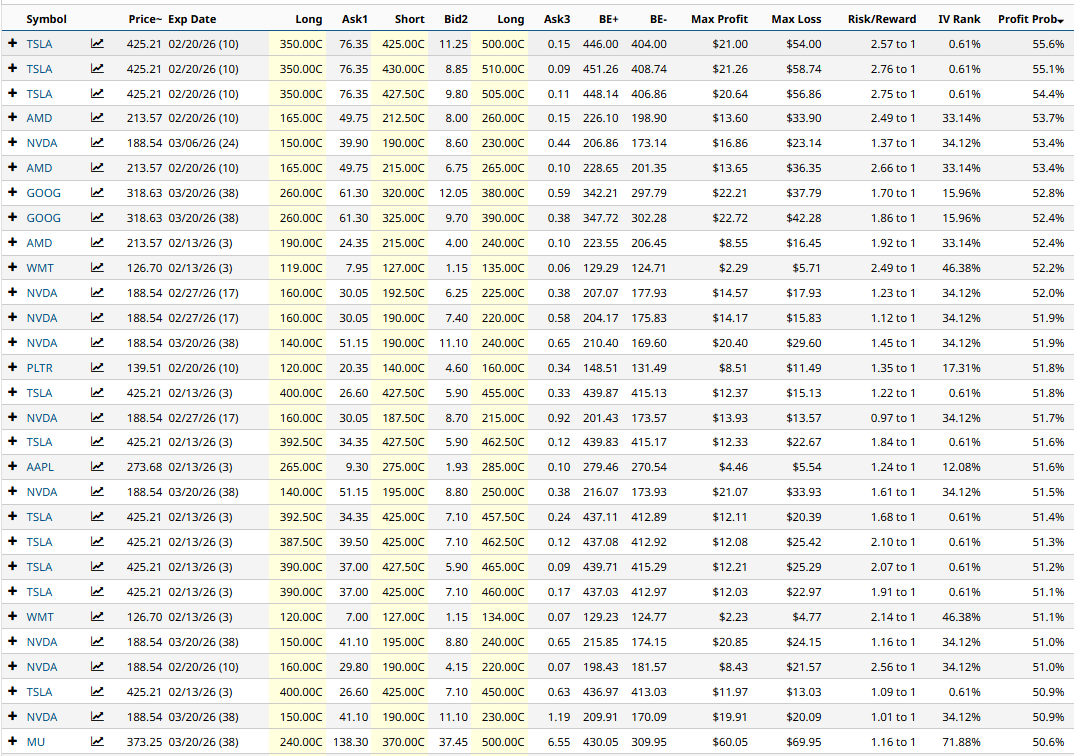
The screener shows some interesting long call butterfly trades on popular stocks such TSLA, AMD, NVDA, GOOG, WMT and PLTR.
Let’s take a look at the first line item – a Long Call Butterfly on Tesla.
Using the February 20 expiry, the trade would involve buying the $350 strike call, selling two of the $425 strike calls and buying one of the $500 strike calls.
The cost for the trade would be $5,400 which is the most the trade could lose. The maximum potential gain is $2,100. The lower breakeven price is $404 and the upper breakeven price is $446. The Risk/Reward Ratio is 2.57 to 1 and the Profit Probability is 55.6%.
You will note that this is a very short-term trade, which can be high risk.
The Barchart Technical Opinion rating is a 8% Buy with a Weakest short term outlook on maintaining the current direction.
AMD Long Call Butterfly Example
Let’s take a look at another example, this time on AMD.
Also using the February 20 expiry, the trade would involve buying the $165 strike call, selling two of the $212.50 strike calls and buying one of the $260 strike calls.
You will note that this is another short-term trade, which can be high risk.
The cost for the trade would be $3,390 which is the most the trade could lose. The maximum potential gain is $1,360. The lower breakeven price is $198.90 and the upper breakeven price is $226.10.
The Risk / Reward Ratio is 2.49 to 1 and the Profit Probability is 53.7%.
The Barchart Technical Opinion rating is a 40% Buy with a Weakest short term outlook on maintaining the current direction.
NVDA Long Call Butterfly Example
Our final example will look at a long call butterfly on Nvidia.
Using the March 6 expiry, the trade would involve buying the $150 strike call, selling two of the $190 strike calls and buying one of the $230 strike calls.
The cost for the trade would be $2,314 which is the most the trade could lose. The maximum potential gain is $1,686. The lower breakeven price is $173.14 and the upper breakeven price is $206.86.
The Risk / Reward Ratio is 1.37 to 1 and the Profit Probability is 55.3%.
The Barchart Technical Opinion rating is a 56% Buy with a Weakening short term outlook on maintaining the current direction.
Long term indicators fully support a continuation of the trend.
Mitigating Risk
Thankfully, Long Call Butterfly Spreads are risk defined trades, so they have some built in risk management. Some trades might like to exit the trade is the upper or lower breakeven price is breached.
Position sizing is important so that a 100% loss does not cause more than a 1-2% loss in total portfolio value.
Long Call Butterfly’s can also contain early assignment risk, so be mindful of that if the short calls are in-the-money and it’s getting close to expiry.
Please remember that options are risky, and investors can lose 100% of their investment.
This article is for education purposes only and not a trade recommendation. Remember to always do your own due diligence and consult your financial advisor before making any investment decisions.
On the date of publication, Gavin McMaster had a position in: NVDA , PLTR . All information and data in this article is solely for informational purposes. For more information please view the Barchart Disclosure Policy here.
More news from Barchart