ETFOptimize | High-performance ETF-based Investment Strategies

Quantitative strategies, Wall Street-caliber research, and insightful market analysis since 1998.


ETFOptimize | HOME
Close Window

lululemon athletica Stock: Analyst Estimates & Ratings

Vancouver, Canada-based lululemon athletica inc. (LULU) designs, distributes, and retails technical athletic apparel, footwear, and accessories for women and men under the lululemon brand. It is valued at a market cap of $20.7 billion

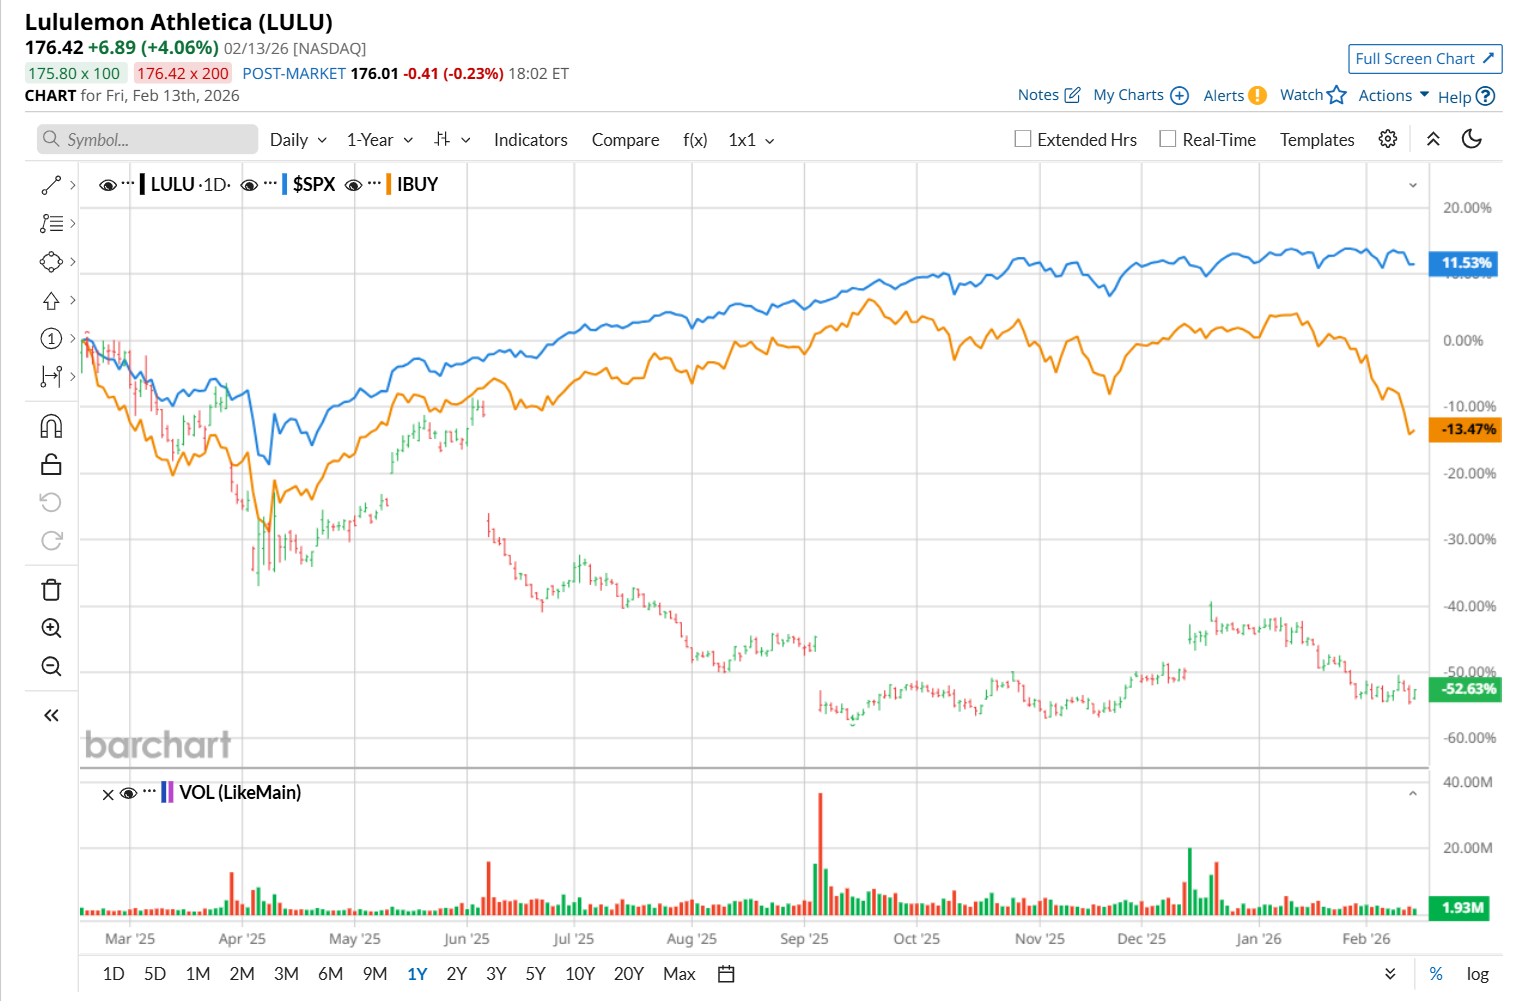
This apparel retail company has notably lagged behind the broader market over the past 52 weeks. Shares of LULU have declined 54.9% over this time frame, while the broader S&P 500 Index ($SPX) has soared 11.8%. Moreover, on a YTD basis, the stock is down 15.1%, compared to SPX’s marginal drop. 


Narrowing the focus, LULU has also underperformed the Amplify Online Retail ETF (IBUY), which decreased 12.3% over the past 52 weeks and 13.9% on a YTD basis. 

www.barchart.com 

On Dec. 11, LULU posted better-than-expected Q3 results, and its shares surged 9.6% in the following trading session. Due to strong growth in international net revenue, the company’s total revenue climbed 7.1% year-over-year to $2.6 billion, surpassing Wall Street expectations by 3.6%. Meanwhile, its EPS declined 9.8% from the year-ago quarter to $2.59, but handily topped analyst expectations of $2.22.

For the current fiscal year, ending in January, analysts expect LULU’s EPS to decline 10.8% year over year to $13.06. The company’s earnings surprise history is promising. It exceeded the consensus estimates in each of the last four quarters.  

Among the 31 analysts covering the stock, the consensus rating is a "Hold,” which is based on two “Strong Buy,” 26 “Hold,” one "Moderate Sell,” and two “Strong Sell” ratings. 

www.barchart.com 

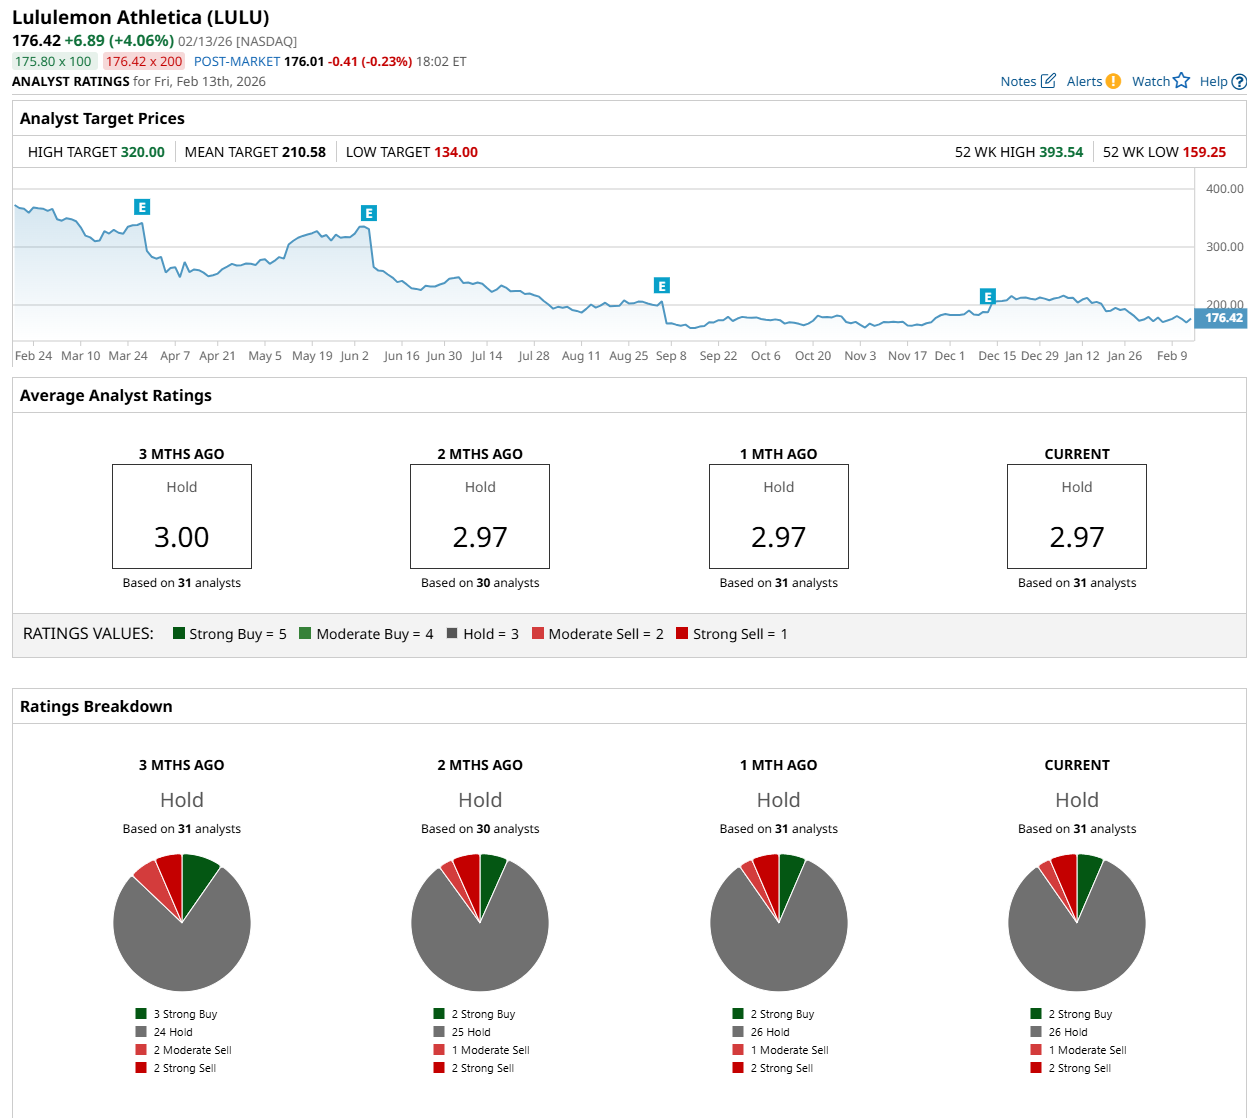
The configuration is slightly less bullish than three months ago, with three analysts suggesting a “Strong Buy” rating.  

On Jan. 20, JPMorgan Chase & Co. (JPM) maintained a "Neutral" rating on LULU and raised its price target to $209, indicating an 18.5% potential upside from the current levels. 

The mean price target of $210.58 represents a 19.4% premium to its current price levels, while its Street-high price target of $320 suggests an ambitious 81.4% potential upside from the current levels. 


On the date of publication, Neharika Jain did not have (either directly or indirectly) positions in any of the securities mentioned in this article. All information and data in this article is solely for informational purposes. For more information please view the Barchart Disclosure Policy here.


More news from Barchart

Recent Quotes

View More
Symbol Price Change (%)
AMZN  211.71
+4.47 (2.16%)
AAPL  252.62
+0.98 (0.39%)
AMD  220.27
+14.90 (7.26%)
BAC  48.75
+0.61 (1.27%)
GOOG  289.59
+0.39 (0.13%)
META  594.89
+1.97 (0.33%)
MSFT  371.04
-1.70 (-0.46%)
NVDA  178.68
+3.48 (1.99%)
ORCL  146.02
-1.07 (-0.73%)
TSLA  385.95
+2.92 (0.76%)
Stock Quote API & Stock News API supplied by www.cloudquote.io
Quotes delayed at least 20 minutes.
By accessing this page, you agree to the Privacy Policy and Terms Of Service.


IntelligentValue Home
Close Window

DISCLAIMER

All content herein is issued solely for informational purposes and is not to be construed as an offer to sell or the solicitation of an offer to buy, nor should it be interpreted as a recommendation to buy, hold or sell (short or otherwise) any security.  All opinions, analyses, and information included herein are based on sources believed to be reliable, but no representation or warranty of any kind, expressed or implied, is made including but not limited to any representation or warranty concerning accuracy, completeness, correctness, timeliness or appropriateness. We undertake no obligation to update such opinions, analysis or information. You should independently verify all information contained on this website. Some information is based on analysis of past performance or hypothetical performance results, which have inherent limitations. We make no representation that any particular equity or strategy will or is likely to achieve profits or losses similar to those shown. Shareholders, employees, writers, contractors, and affiliates associated with ETFOptimize.com may have ownership positions in the securities that are mentioned. If you are not sure if ETFs, algorithmic investing, or a particular investment is right for you, you are urged to consult with a Registered Investment Advisor (RIA). Neither this website nor anyone associated with producing its content are Registered Investment Advisors, and no attempt is made herein to substitute for personalized, professional investment advice. Neither ETFOptimize.com, Global Alpha Investments, Inc., nor its employees, service providers, associates, or affiliates are responsible for any investment losses you may incur as a result of using the information provided herein. Remember that past investment returns may not be indicative of future returns.

Copyright © 1998-2017 ETFOptimize.com, a publication of Optimized Investments, Inc. All rights reserved.