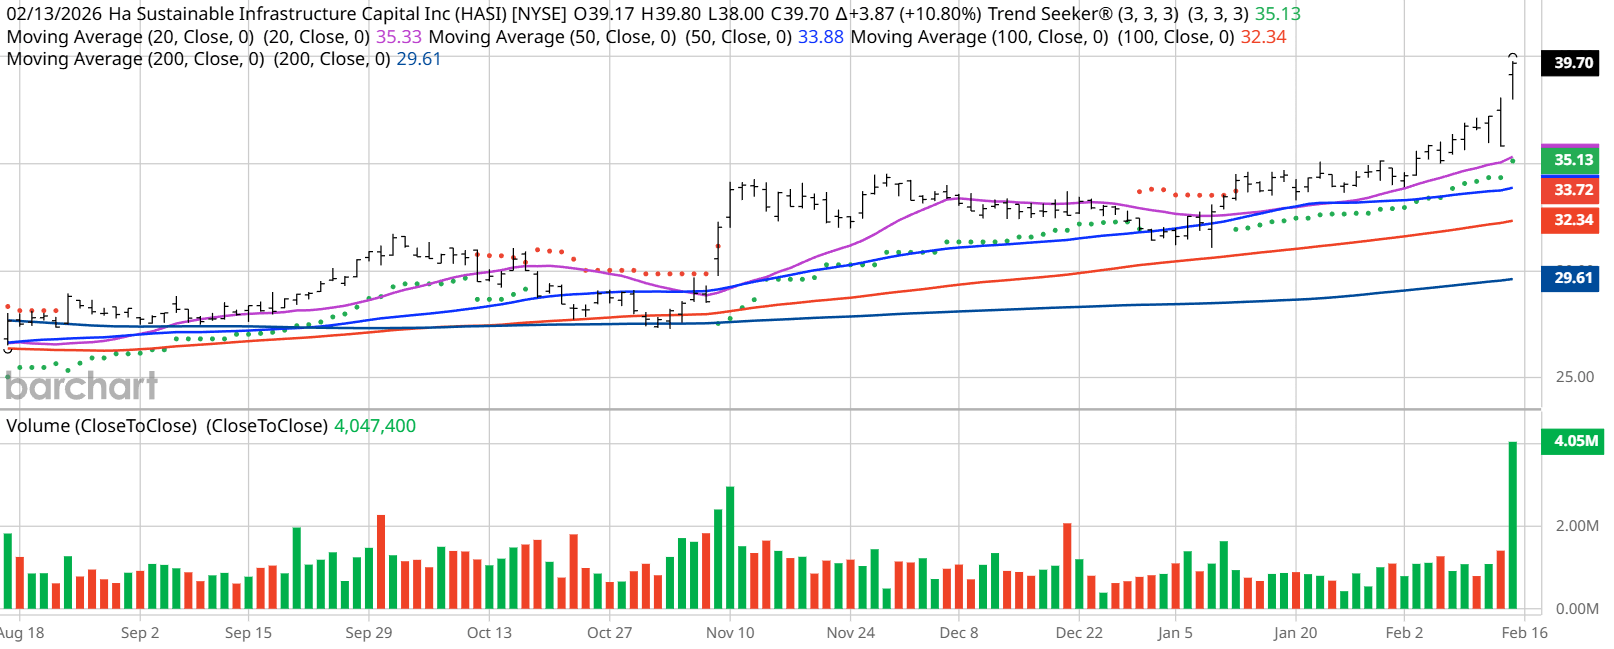
- HA Sustainable Infrastructure Capital (HASI) is trading at new 3-year highs.
- The stock is up more than 40% over the past 52 weeks.
- HASI has strong technical momentum and maintains a 100% “Buy” opinion from Barchart.
- Analyst sentiment is predominantly positive, with multiple “Strong Buy” ratings and a diversified revenue base.
Today’s Featured Stock
Valued at $5.02 billion, HA Sustainable Infrastructure Capital (HASI) is a climate positive investment firm which actively partners with clients to deploy real assets that facilitate the clean energy transition.
What I’m Watching
I found today’s Chart of the Day by using Barchart’s powerful screening functions to sort for stocks with the highest technical buy signals; superior current momentum in both strength and direction; and a Trend Seeker “buy” signal. I then used Barchart’s Flipcharts feature to review the charts for consistent price appreciation. HASI checks those boxes. Since the Trend Seeker issued a new “Buy” on Jan. 13, shares are up 16.71%.
Barchart Technical Indicators for HA Sustainable Infrastructure Capital
Editor’s Note: The technical indicators below are updated live during the session every 20 minutes and can therefore change each day as the market fluctuates. The indicator numbers shown below therefore may not match what you see live on the Barchart.com website when you read this report. These technical indicators form the Barchart Opinion on a particular stock.
HASI scored a 3-year high of $39.84 on Feb. 17.
- HASI has a Weighted Alpha of +56.47.
- The company has a 100% “Buy” opinion from Barchart.
- The stock has gained 41.83% over the past 52 weeks.
- HASI has its Trend Seeker “Buy” signal intact.
- The stock recently traded at $39.84 with a 50-day moving average of $34.01.
- HASI has made 14 new highs and is up 15.29% over the past month.
- Relative Strength Index (RSI) is at 72.73.
- There’s a technical support level around $38.53.
Don’t Forget the Fundamentals
- $5.02 billion market capitalization.
- 14.45x trailing price-earnings ratio.
- 4.28% dividend yield.
- Revenue is expected to grow 8.12% this year and another 11.13% next year.
- Earnings are estimated to increase 10.96% next year.
Analyst and Investor Sentiment on HA Sustainable Infrastructure Capital
- The Wall Street analysts followed by Barchart gave the stock 12 “Strong Buy,” 1 “Moderate Buy,” and 3 “Hold” opinions.
- Value Line rates the stock “Highest.”
- CFRA’s MarketScope rates the stock a “Hold.”
- Morningstar thinks the stock is fairly valued.
- 168 investors following the stock on Motley Fool think this stock will beat the market while 18 think it won’t.
- 27,310 investors are following the stock on Seeking Alpha, which rates it a “Buy.”
- Short interest is 8.81% of the float with 10.95 days to cover the float.
The Bottom Line on HA Sustainable Infrastructure Capital
HASI offers a competitive dividend yield, supported by diversified revenue streams from solar, wind, and natural gas investments, making it an attractive option for income investors looking to benefit from the growth of green energy.
Additional disclosure: The Barchart Chart of the Day highlights stocks that are experiencing exceptional current price appreciation. They are not intended to be buy recommendations as these stocks are extremely volatile and speculative. Should you decide to add one of these stocks to your investment portfolio it is highly suggested you follow a predetermined diversification and moving stop loss discipline that is consistent with your personal investment risk tolerance.
On the date of publication, Jim Van Meerten did not have (either directly or indirectly) positions in any of the securities mentioned in this article. All information and data in this article is solely for informational purposes. For more information please view the Barchart Disclosure Policy here.
More news from Barchart
- Why 1 Analyst Just Raised His Micron Stock Price Target by 30%
- As Microsoft Bets on ‘True Self-Sufficiency,’ Should You Bet on MSFT Stock?
- Don’t Fall for False Buy Signals! How to Find Better Trade Entries
- You May Never Have Heard of Corsair Gaming But Its Stock Just Jumped 50%. Should You Buy Shares Here?


