ETFOptimize | High-performance ETF-based Investment Strategies

Quantitative strategies, Wall Street-caliber research, and insightful market analysis since 1998.


ETFOptimize | HOME
Close Window

Do Wall Street Analysts Like General Dynamics Stock?

General Dynamics Corporation (GD), headquartered in Reston, Virginia, operates as a global aerospace and defense company. Valued at $94 billion by market cap, the company offers a broad portfolio of products and services in business aviation, combat vehicles, weapons systems, munitions, shipbuilding design and construction, information systems, and technologies.

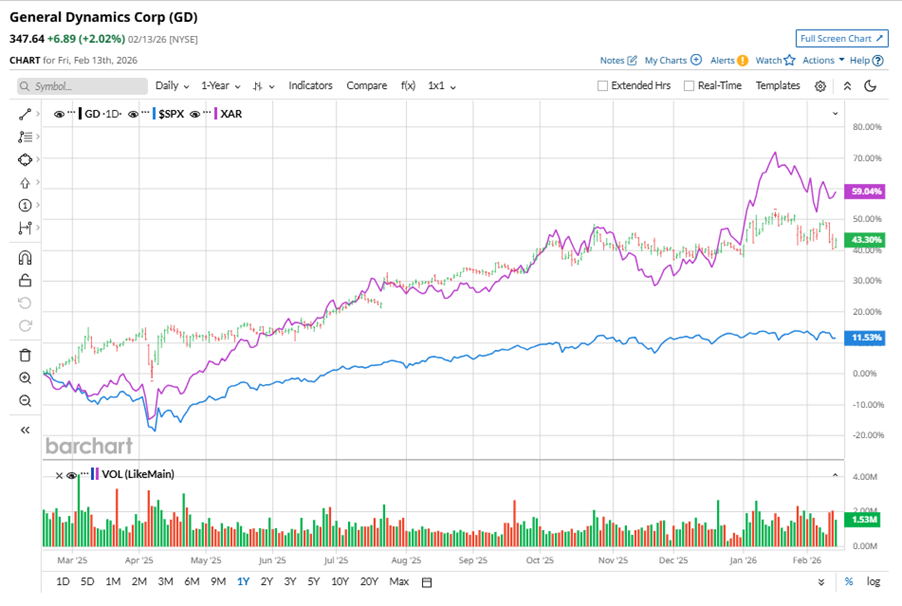
Shares of this defense giant have outperformed the broader market considerably over the past year. GD has gained 41.2% over this time frame, while the broader S&P 500 Index ($SPX) has rallied nearly 11.8%. In 2026, GD’s stock rose 3.3%, surpassing the SPX’s marginal fall on a YTD basis. 


Narrowing the focus, GD’s underperformance is apparent compared to the SPDR S&P Aerospace & Defense ETF (XAR). The exchange-traded fund has gained about 59.2% over the past year. Moreover, the ETF’s 12.2% gains on a YTD basis outshine the stock’s single-digit returns over the same time frame. 

www.barchart.com

General Dynamics' performance was driven by strong demand in Aerospace and Combat Systems, with notable order intake in defense segments and Gulfstream jets. Management is focused on expanding shipyard production and investing in next-gen defense tech, but remains cautious due to cost inflation and supply chain constraints.

On Jan. 28, GD shares closed down by 2.7% after reporting its Q4 results. Its EPS of $4.17 surpassed Wall Street expectations of $4.11. The company’s revenue was $14.4 billion, topping Wall Street forecasts of $13.8 billion.

For fiscal 2026, ending in December, analysts expect GD’s EPS to grow 5.2% to $16.26 on a diluted basis. The company’s earnings surprise history is impressive. It beat the consensus estimate in each of the last four quarters.

Among the 23 analysts covering GD stock, the consensus is a “Moderate Buy.” That’s based on 12 “Strong Buy” ratings, 10 “Holds,” and one “Strong Sell.” 

www.barchart.com

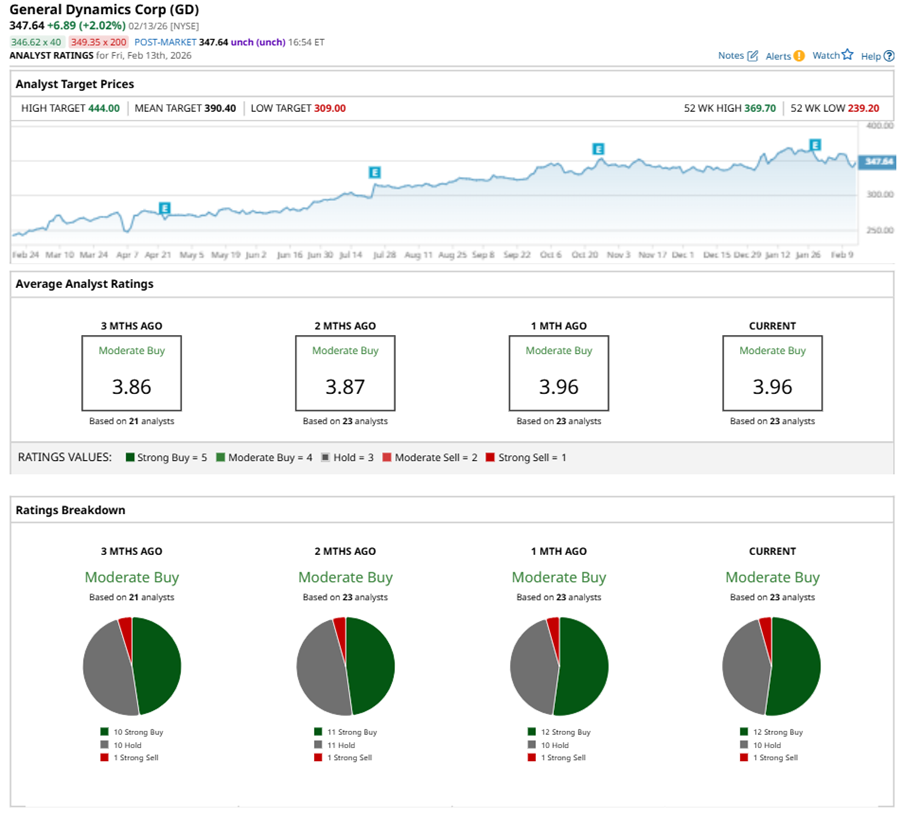
This configuration is more bullish than two months ago, with 11 analysts suggesting a “Strong Buy.”

On Feb. 1, Jefferies Financial Group Inc. (JEF) analyst Sheila Kahyaoglu kept a “Hold” rating on GD and raised the price target to $385, implying a potential upside of 10.7% from current levels.

The mean price target of $390.40 represents a 12.3% premium to GD’s current price levels. The Street-high price target of $444 suggests an upside potential of 27.7%. 


On the date of publication, Neha Panjwani did not have (either directly or indirectly) positions in any of the securities mentioned in this article. All information and data in this article is solely for informational purposes. For more information please view the Barchart Disclosure Policy here.


More news from Barchart

Recent Quotes

View More
Symbol Price Change (%)
AMZN  201.15
+2.36 (1.19%)
AAPL  263.88
+8.10 (3.17%)
AMD  203.08
-4.24 (-2.05%)
BAC  52.74
+0.19 (0.36%)
GOOG  302.82
-3.20 (-1.05%)
META  639.29
-0.48 (-0.08%)
MSFT  396.86
-4.46 (-1.11%)
NVDA  184.97
+2.16 (1.18%)
ORCL  153.97
-6.17 (-3.85%)
TSLA  410.63
-6.81 (-1.63%)
Stock Quote API & Stock News API supplied by www.cloudquote.io
Quotes delayed at least 20 minutes.
By accessing this page, you agree to the Privacy Policy and Terms Of Service.


IntelligentValue Home
Close Window

DISCLAIMER

All content herein is issued solely for informational purposes and is not to be construed as an offer to sell or the solicitation of an offer to buy, nor should it be interpreted as a recommendation to buy, hold or sell (short or otherwise) any security.  All opinions, analyses, and information included herein are based on sources believed to be reliable, but no representation or warranty of any kind, expressed or implied, is made including but not limited to any representation or warranty concerning accuracy, completeness, correctness, timeliness or appropriateness. We undertake no obligation to update such opinions, analysis or information. You should independently verify all information contained on this website. Some information is based on analysis of past performance or hypothetical performance results, which have inherent limitations. We make no representation that any particular equity or strategy will or is likely to achieve profits or losses similar to those shown. Shareholders, employees, writers, contractors, and affiliates associated with ETFOptimize.com may have ownership positions in the securities that are mentioned. If you are not sure if ETFs, algorithmic investing, or a particular investment is right for you, you are urged to consult with a Registered Investment Advisor (RIA). Neither this website nor anyone associated with producing its content are Registered Investment Advisors, and no attempt is made herein to substitute for personalized, professional investment advice. Neither ETFOptimize.com, Global Alpha Investments, Inc., nor its employees, service providers, associates, or affiliates are responsible for any investment losses you may incur as a result of using the information provided herein. Remember that past investment returns may not be indicative of future returns.

Copyright © 1998-2017 ETFOptimize.com, a publication of Optimized Investments, Inc. All rights reserved.