ETFOptimize | High-performance ETF-based Investment Strategies

Quantitative strategies, Wall Street-caliber research, and insightful market analysis since 1998.


ETFOptimize | HOME
Close Window

Is Texas Instruments Stock Underperforming the Dow?

Texas Instruments Incorporated (TXN) designs, manufactures, and sells semiconductors to electronics designers and manufacturers. With a market cap of $199.5 billion, the company develops analog ICs and embedded processors. 

Companies worth $10 billion or more are generally described as “large-cap stocks,” and TXN definitely fits that description, with its market cap exceeding this threshold, reflecting its substantial size, influence, and dominance in the semiconductors industry. TXN remains the global leader in analog chip production, providing essential components for processing real-world signals. This dominance showcases the company's innovation and competitive edge in the semiconductor market. With a diverse product range including processors, microcontrollers, and calculators, TXN mitigates risk and capitalizes on cross-selling opportunities within its customer base.


Despite its notable strength, TXN slipped 7.8% from its 52-week high of $231.32, achieved on Feb. 11. Over the past three months, TXN stock gained 32.3%, outperforming Dow Jones Industrials Average’s ($DOWI) 5.9% gains during the same time frame.

www.barchart.com

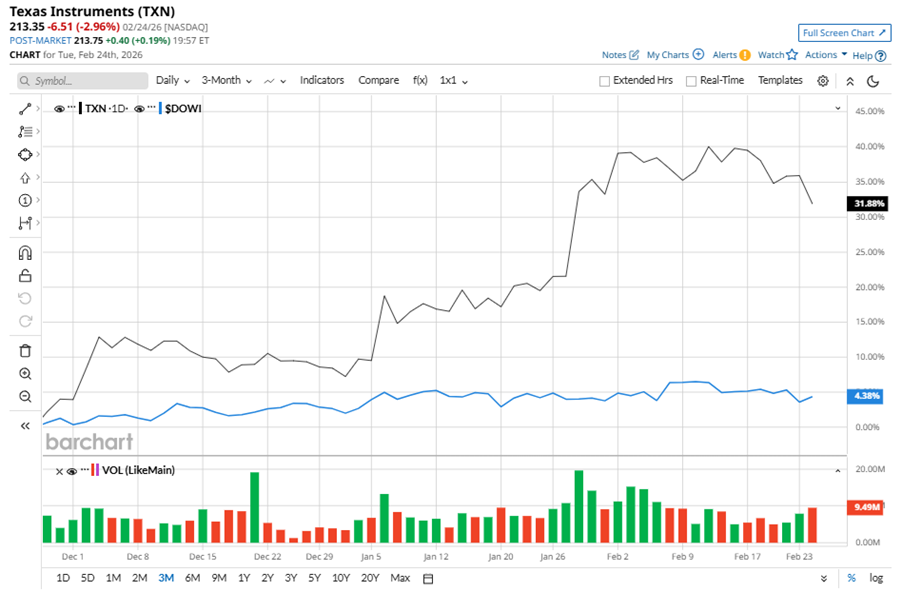
Shares of TXN rose 23% on a YTD basis, outperforming DOWI’s YTD gains of 2.3%. However, in the longer term, the stock climbed 6.3% over the past 52 weeks, underperforming DOWI’s 13.2% returns over the last year.

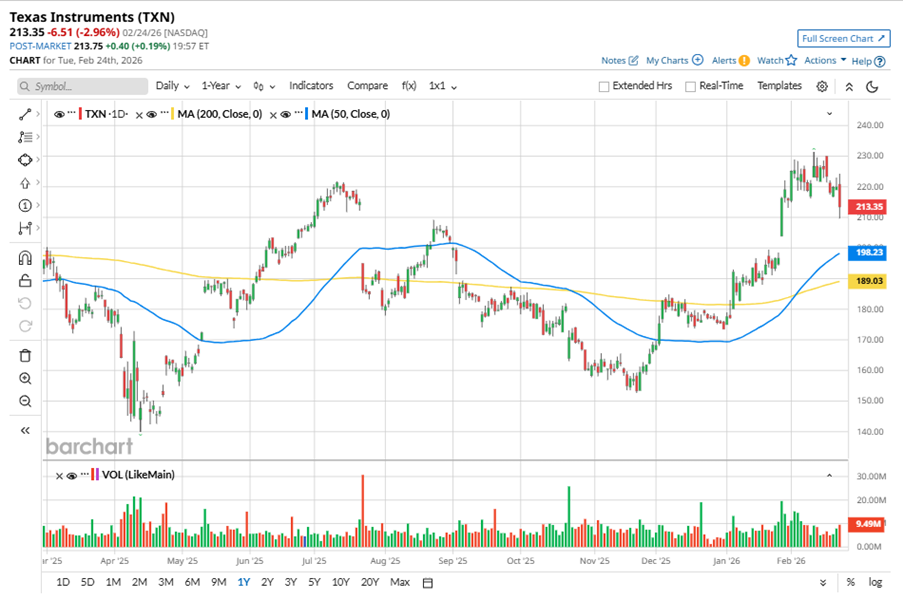
To confirm the bullish trend, TXN has been trading above its 200-day moving average since early January. The stock is trading above its 50-day moving average since early December, 2025. 

www.barchart.com

On Jan. 27, TXN reported its Q4 results, and its shares closed up by 9.9% in the following trading session. Its EPS of $1.27 fell short of Wall Street expectations of $1.30. The company’s revenue was $4.42 billion, missing Wall Street forecasts of $4.44 billion. For Q1, TXN expects revenue in the range of $4.3 billion to $4.7 billion.

In the competitive arena of semiconductors, Analog Devices, Inc. (ADI) has taken the lead over TXN, showing resilience with a 31.3% uptick on a YTD basis and 50.3% gain over the past 52 weeks.

Wall Street analysts are reasonably bullish on TXN’s prospects. The stock has a consensus “Moderate Buy” rating from the 35 analysts covering it, and the mean price target of $217.22 suggests a potential upside of 1.8% from current price levels.


On the date of publication, Neha Panjwani did not have (either directly or indirectly) positions in any of the securities mentioned in this article. All information and data in this article is solely for informational purposes. For more information please view the Barchart Disclosure Policy here.


More news from Barchart

Recent Quotes

View More
Symbol Price Change (%)
AMZN  211.96
-2.37 (-1.11%)
AAPL  260.18
-0.65 (-0.25%)
AMD  204.07
+0.84 (0.41%)
BAC  48.30
-0.26 (-0.54%)
GOOG  307.82
+0.89 (0.29%)
META  651.68
-2.39 (-0.37%)
MSFT  403.62
-2.14 (-0.53%)
NVDA  185.10
+0.33 (0.18%)
ORCL  162.07
+12.67 (8.48%)
TSLA  405.11
+5.88 (1.47%)
Stock Quote API & Stock News API supplied by www.cloudquote.io
Quotes delayed at least 20 minutes.
By accessing this page, you agree to the Privacy Policy and Terms Of Service.


IntelligentValue Home
Close Window

DISCLAIMER

All content herein is issued solely for informational purposes and is not to be construed as an offer to sell or the solicitation of an offer to buy, nor should it be interpreted as a recommendation to buy, hold or sell (short or otherwise) any security.  All opinions, analyses, and information included herein are based on sources believed to be reliable, but no representation or warranty of any kind, expressed or implied, is made including but not limited to any representation or warranty concerning accuracy, completeness, correctness, timeliness or appropriateness. We undertake no obligation to update such opinions, analysis or information. You should independently verify all information contained on this website. Some information is based on analysis of past performance or hypothetical performance results, which have inherent limitations. We make no representation that any particular equity or strategy will or is likely to achieve profits or losses similar to those shown. Shareholders, employees, writers, contractors, and affiliates associated with ETFOptimize.com may have ownership positions in the securities that are mentioned. If you are not sure if ETFs, algorithmic investing, or a particular investment is right for you, you are urged to consult with a Registered Investment Advisor (RIA). Neither this website nor anyone associated with producing its content are Registered Investment Advisors, and no attempt is made herein to substitute for personalized, professional investment advice. Neither ETFOptimize.com, Global Alpha Investments, Inc., nor its employees, service providers, associates, or affiliates are responsible for any investment losses you may incur as a result of using the information provided herein. Remember that past investment returns may not be indicative of future returns.

Copyright © 1998-2017 ETFOptimize.com, a publication of Optimized Investments, Inc. All rights reserved.