- Nordic American Tanker Shipping (NAT) operates a leading Suezmax fleet.
- Shares are up more than 93% over the past 52 weeks.
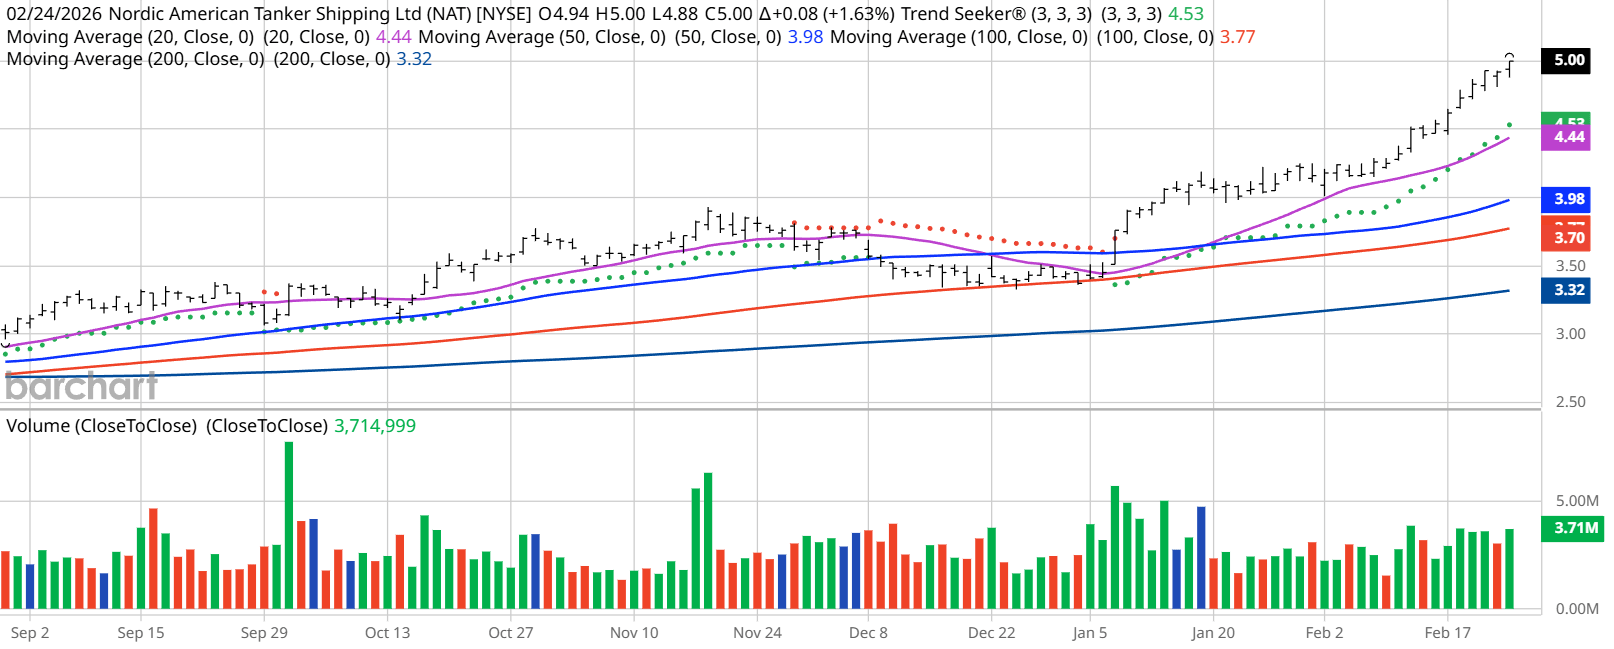
- NAT is trading at a new 52-week high.
- The stock maintains a 100% “Buy” technical opinion from Barchart and has strong momentum.
Today’s Featured Stock
Valued at $1.04 billion, Nordic American Tanker Shipping (NAT) operates one of the largest fleets of Suezmax tankers in the world. The fleet consists of 24 Suezmax tankers, including two newbuilds.
What I’m Watching
I found today’s Chart of the Day by using Barchart’s powerful screening functions to sort for stocks with the highest technical buy signals; superior current momentum in both strength and direction; and a Trend Seeker “buy” signal. I then used Barchart’s Flipcharts feature to review the charts for consistent price appreciation. NAT checks those boxes. Since the Trend Seeker issued a new “Buy” on Jan. 8, shares are up 27.43%.
Barchart Technical Indicators for Nordic American Tanker Shipping
Editor’s Note: The technical indicators below are updated live during the session every 20 minutes and can therefore change each day as the market fluctuates. The indicator numbers shown below therefore may not match what you see live on the Barchart.com website when you read this report. These technical indicators form the Barchart Opinion on a particular stock.
Nordic American scored a 5-Year high of $5.00 on Feb. 24.
- NAT has a Weighted Alpha of +115.29.
- Nordic American has a 100% “Buy” opinion from Barchart.
- The stock has gained 93.38% over the past 52 weeks.
- Nordic American has its Trend Seeker “Buy” signal intact.
- The stock recently traded at $4.91 with a 50-day moving average of $4.01.
- NAT has made 17 new highs and is up 22.41% over the past month.
- Relative Strength Index (RSI) is at 77.02.
- There’s a technical support level around $4.92.
Don’t Forget the Fundamentals
- $1.04 billion market capitalization.
- 246x trailing price-earnings ratio.
- 10.4% dividend yield.
- Revenue is expected to grow 24.77% next year.
- Earnings are estimated to increase 388.88% next year.
Analyst and Investor Sentiment on Nordic American
- The Wall Street analysts tracked by Barchart gave the stock 3 “Strong Buy” and 2 “Hold” opinions with price targets between $3.80 and $5.
- CFRA’s MarketScope rates the stock a “Sell.”
- Morningstar thinks the stock is fairly valued.
- 29,190 investors are following the stock on Seeking Alpha, which rates it a “Hold.”
- Short interest is 5.99% of the float with 4.71 days to cover the float.
The Bottom Line on Nordic American
With a 10.4% dividend, NAT is a real cash cow, but analysts don’t predict much upside price appreciation.
Additional disclosure: The Barchart Chart of the Day highlights stocks that are experiencing exceptional current price appreciation. They are not intended to be buy recommendations as these stocks are extremely volatile and speculative. Should you decide to add one of these stocks to your investment portfolio it is highly suggested you follow a predetermined diversification and moving stop loss discipline that is consistent with your personal investment risk tolerance.
On the date of publication, Jim Van Meerten did not have (either directly or indirectly) positions in any of the securities mentioned in this article. All information and data in this article is solely for informational purposes. For more information please view the Barchart Disclosure Policy here.
More news from Barchart