Headquartered in Zurich, Switzerland, Chubb Limited (CB) is a global insurer offering commercial and personal property and casualty coverage, reinsurance, and life insurance solutions. With a market cap of nearly $132.6 billion, it firmly occupies the “large-cap” arena reserved for companies valued above $10 billion.
The scale gives Chubb the balance sheet strength to underwrite specialty risks, structure accident and health programs, absorb catastrophe exposures, and deliver long-term protection and savings products across global markets.
CB stock is currently trading just 1.1% below its February high of $338.19, holding close to peak levels. Over the past three months, the shares have gained 12.4%, while the State Street Financial Select Sector SPDR ETF (XLF) declined 1.3% during the same period, marking clear short-term outperformance against the broader financials space.
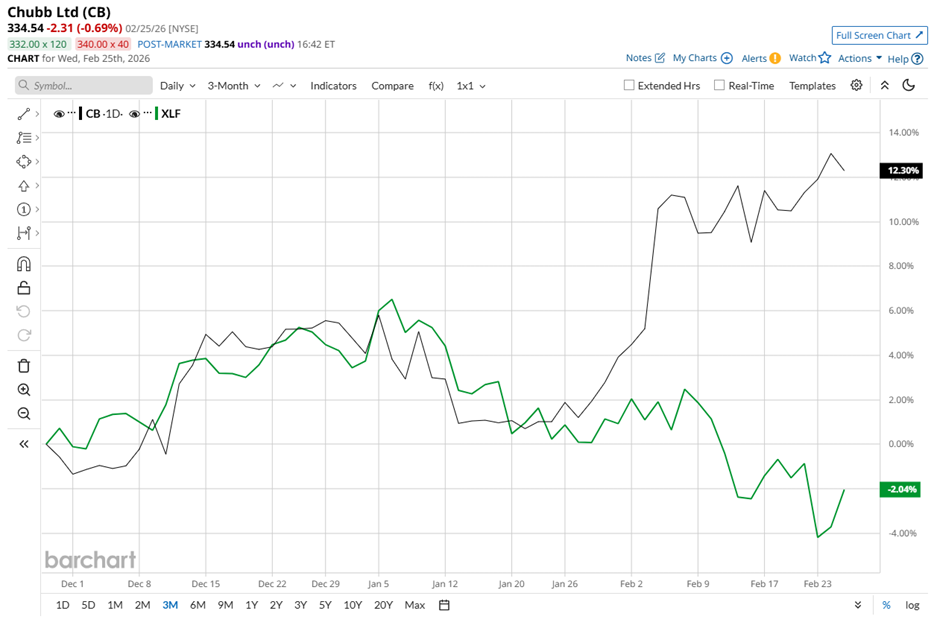
The longer view tells the same story. Over the past 52 weeks, CB stock has advanced 20.6% and remains up 7.2% year-to-date (YTD). In comparison, XLF has risen 1.8% over the same 52-week stretch and fallen 5.3% YTD. Across both time frames, CB has outperformed the sector benchmark, reflecting sustained relative strength.
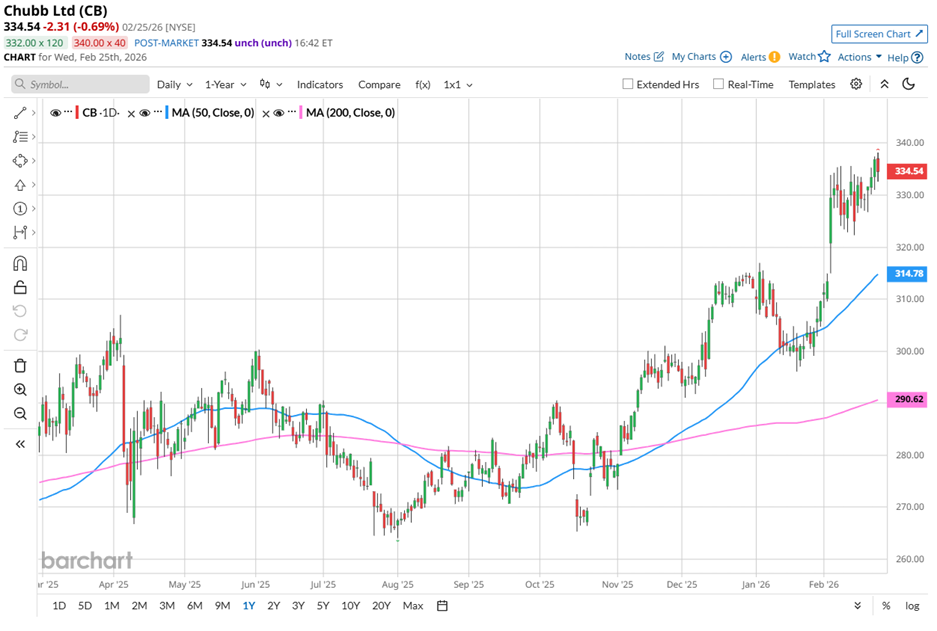
The technical backdrop reinforces the fundamental picture. Since November 2025, CB has traded above its 50-day moving average of $314.78 and its 200-day moving average of $290.62. The stock briefly slipped below its 50-day average in January but quickly reclaimed that level and resumed its upward trajectory.
On Feb. 3, Chubb released its fourth-quarter fiscal 2025 results, and its stock rose 5.1% in the following session. Net income rose 24.7% year over year to $3.2 billion. Meanwhile, adjusted EPS came in at $7.52, surpassing the $6.78 analyst estimate and improving 24.9% from the prior-year level.
Management attributed the quarter’s performance to strong growth in property and casualty and life segments, supported by record investment income. CEO Evan Greenberg stated that very strong double-digit increases in underwriting and life income, together with record investment income, drove core operating income to nearly $3 billion.
Looking forward, management expects adjusted net investment income in the first quarter of 2026 to range between $1.81 billion and $1.84 billion. The projection reflects continued benefit from portfolio scale and prevailing rate conditions.
For comparison, Chubb’s rival, The Allstate Corporation (ALL), has gained 9.9% over the past 52 weeks and is marginally positive YTD. Against that backdrop, Chubb’s gains illustrate stronger price momentum supported by earnings consistency.
Currently, CB stock carries a “Moderate Buy” consensus rating from 26 analysts, and the mean price target of $340.79 implies a premium of 1.9% to current trading levels.
On the date of publication, Aanchal Sugandh did not have (either directly or indirectly) positions in any of the securities mentioned in this article. All information and data in this article is solely for informational purposes. For more information please view the Barchart Disclosure Policy here.
More news from Barchart