ETFOptimize | High-performance ETF-based Investment Strategies

Quantitative strategies, Wall Street-caliber research, and insightful market analysis since 1998.


ETFOptimize | HOME
Close Window

Is Boston Scientific Stock Underperforming the Dow?

The Marlborough, Massachusetts-based Boston Scientific Corporation (BSX) designs and commercializes medical devices that power minimally invasive procedures across cardiovascular, urology, neurology, oncology, and gastrointestinal care. 

With a market capitalization of about $111.5 billion, the company stands in the “large-cap” territory, a bracket reserved for businesses valued above $10 billion. This scale provides reach, capital flexibility, and a global sales infrastructure that supports hospitals and specialists across developed and emerging markets alike. 


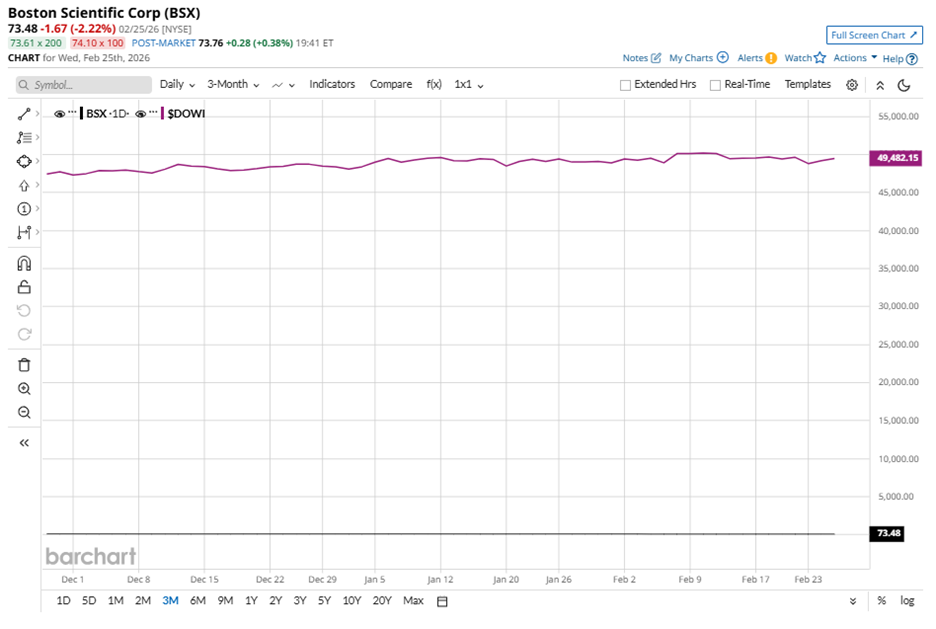
Yet the market has taken a different view in recent months. BSX stock is trading 32.9% below its September 2025 high of $109.50 and has declined 27.5% over the last three months. Over that same stretch, the Dow Jones Industrial Average ($DOWIgained 5%

www.barchart.com

The weakness extends further. Over the past 52 weeks, Boston Scientific’s shares have slipped 27.1% and are down nearly 22.9% year-to-date (YTD). By contrast, the Dow advanced 13.4% over 52 weeks and 3% YTD. 

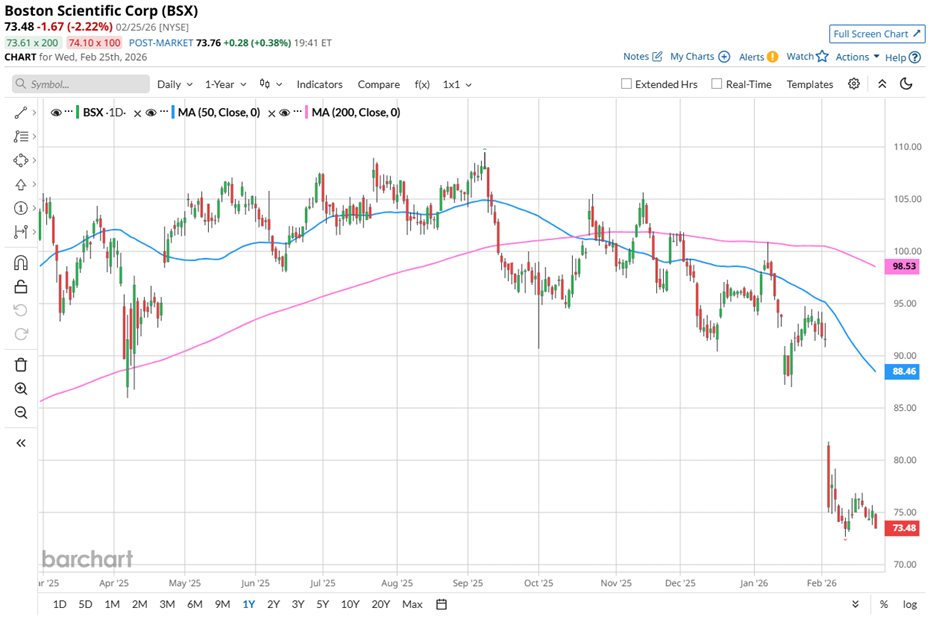
Technical signals reinforce the pressure. The stock has traded below its 50-day moving average of $88.46 and its 200-day moving average of $98.53 since December 2025.

www.barchart.com

On Feb. 4, shares fell another 17.6% after the company released fourth-quarter fiscal 2025 financial results. Net sales rose 15.9% year over year to $5.29 billion, essentially matching analyst expectations of $5.27 billion. Adjusted EPS grew 14.3% from the year-ago value to $0.80, exceeding Street’s estimates of $0.78. The quarter, on its own merits, demonstrated operational execution.

Yet markets trade in direction, not history. While management guided full-year 2026 adjusted earnings to a midpoint of $3.46 per share, in line with consensus, first-quarter guidance landed slightly below Wall Street projections. The modest shortfall shifted attention from delivered performance to near-term uncertainty.

The contrast with peers adds another layer. Over the past 52 weeks, Abbott Laboratories (ABThas plunged 15.5% and is down 8.4% YTD, showing that even Boston Scientific’s sector counterparts are struggling.

Despite recent weakness, analysts maintain conviction. The stock carries a “Strong Buy” consensus from 31 analysts, with a mean price target of $107.90. From current levels, that implies 46.8% upside potential.


On the date of publication, Aanchal Sugandh did not have (either directly or indirectly) positions in any of the securities mentioned in this article. All information and data in this article is solely for informational purposes. For more information please view the Barchart Disclosure Policy here.


More news from Barchart

Recent Quotes

View More
Symbol Price Change (%)
AMZN  213.24
-0.25 (-0.12%)
AAPL  259.57
-0.31 (-0.12%)
AMD  204.49
+1.81 (0.89%)
BAC  48.46
+0.56 (1.17%)
GOOG  307.38
+1.37 (0.45%)
META  656.19
+8.80 (1.36%)
MSFT  407.53
-1.88 (-0.46%)
NVDA  182.57
-0.08 (-0.04%)
ORCL  151.02
-0.54 (-0.36%)
TSLA  403.78
+5.10 (1.28%)
Stock Quote API & Stock News API supplied by www.cloudquote.io
Quotes delayed at least 20 minutes.
By accessing this page, you agree to the Privacy Policy and Terms Of Service.


IntelligentValue Home
Close Window

DISCLAIMER

All content herein is issued solely for informational purposes and is not to be construed as an offer to sell or the solicitation of an offer to buy, nor should it be interpreted as a recommendation to buy, hold or sell (short or otherwise) any security.  All opinions, analyses, and information included herein are based on sources believed to be reliable, but no representation or warranty of any kind, expressed or implied, is made including but not limited to any representation or warranty concerning accuracy, completeness, correctness, timeliness or appropriateness. We undertake no obligation to update such opinions, analysis or information. You should independently verify all information contained on this website. Some information is based on analysis of past performance or hypothetical performance results, which have inherent limitations. We make no representation that any particular equity or strategy will or is likely to achieve profits or losses similar to those shown. Shareholders, employees, writers, contractors, and affiliates associated with ETFOptimize.com may have ownership positions in the securities that are mentioned. If you are not sure if ETFs, algorithmic investing, or a particular investment is right for you, you are urged to consult with a Registered Investment Advisor (RIA). Neither this website nor anyone associated with producing its content are Registered Investment Advisors, and no attempt is made herein to substitute for personalized, professional investment advice. Neither ETFOptimize.com, Global Alpha Investments, Inc., nor its employees, service providers, associates, or affiliates are responsible for any investment losses you may incur as a result of using the information provided herein. Remember that past investment returns may not be indicative of future returns.

Copyright © 1998-2017 ETFOptimize.com, a publication of Optimized Investments, Inc. All rights reserved.