ETFOptimize | High-performance ETF-based Investment Strategies

Quantitative strategies, Wall Street-caliber research, and insightful market analysis since 1998.


ETFOptimize | HOME
Close Window

Is Vertex Stock Outperforming the Dow?

With a market cap of $122.7 billion, Vertex Pharmaceuticals Incorporated (VRTX) is a leading biotechnology company focused on discovering, developing, and commercializing transformative medicines for serious diseases, particularly in areas of high unmet medical need. Founded in 1989 and headquartered in Boston, Massachusetts, Vertex is best known for building the first and dominant class of therapies that treat the underlying cause of cystic fibrosis (CF), establishing a durable global franchise with blockbuster drugs such as Trikafta/Kaftrio.

Companies valued at $10 billion or more are generally considered "large-cap" stocks, and Vertex fits this criterion perfectly, exceeding the mark. 


However, the pharma company has fallen 7.1% from its 52-week high of $519.68 achieved on March 14 last year. Despite this recent pullback, shares of Vertex have gained 12.4% over the past three months, outpacing the Dow Jones Industrial Average’s ($DOWI5% rise during the same time frame.

www.barchart.com

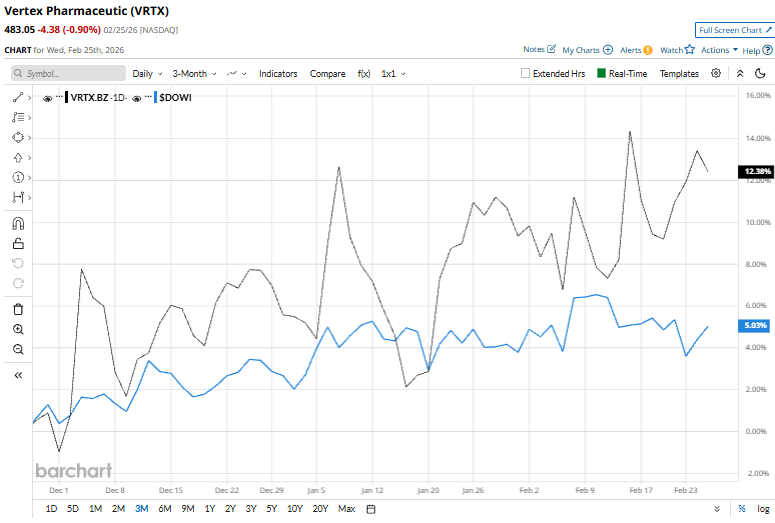
In the long term, VRTX is up 6.6% on a YTD basis, outpacing $DOWI's 3% gains. However, VRTX stock has surged marginally over the past 52 weeks, compared to the index’s 13.4% over the same time frame.

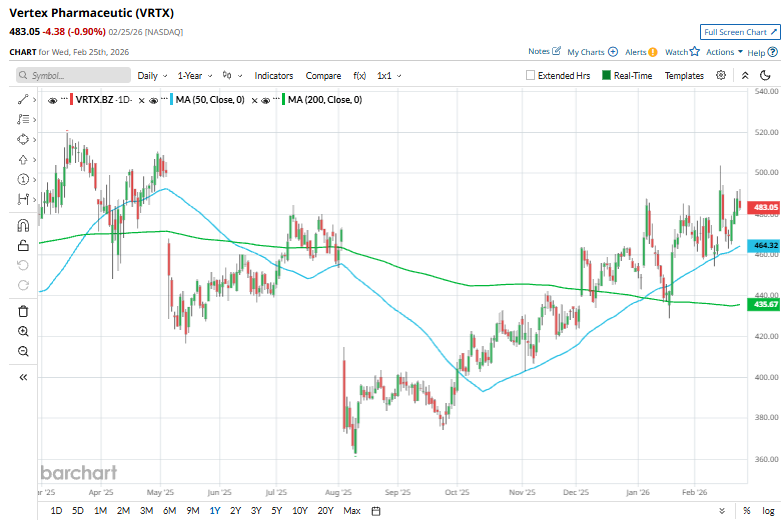
To confirm the bullish price trend, VRTX has been trading above its 50-day moving average since early October and over its 200-day moving average since December

www.barchart.com

On Feb. 12, Vertex reported Q4 2025 earnings, with revenue of $3.19 billion, up 10% year over year, driven by continued strength in its cystic fibrosis franchise and early contributions from newer therapies, including Alyftrek, Casgevy, and Journavx. U.S. revenue rose 12% to $2.06 billion, driven by strong CF demand and pricing, while international revenue increased 5% to $1.13 billion. But, operating expenses increased modestly due to commercial investment supporting the Journavx launch. Non-GAAP net income improved to $1.3 billion, reflecting higher product revenue and a favorable one-time tax benefit that lowered effective tax rates. Its shares rose 5.7% in the next trading session. 

VRTX has underperformed its key rival, Biogen Inc. (BIIB), which has surged 8.4% in 2026 and 33% over the past year.

The stock has a consensus rating of "Moderate Buy" from the 32 analysts covering it, and it currently trades above its mean price target of $533.12.


On the date of publication, Kritika Sarmah did not have (either directly or indirectly) positions in any of the securities mentioned in this article. All information and data in this article is solely for informational purposes. For more information please view the Barchart Disclosure Policy here.


More news from Barchart

Recent Quotes

View More
Symbol Price Change (%)
AMZN  213.12
-0.37 (-0.17%)
AAPL  259.27
-0.61 (-0.23%)
AMD  204.04
+1.36 (0.67%)
BAC  48.43
+0.53 (1.11%)
GOOG  306.96
+0.95 (0.31%)
META  655.45
+8.06 (1.24%)
MSFT  407.32
-2.09 (-0.51%)
NVDA  182.39
-0.26 (-0.14%)
ORCL  150.82
-0.74 (-0.49%)
TSLA  403.60
+4.92 (1.23%)
Stock Quote API & Stock News API supplied by www.cloudquote.io
Quotes delayed at least 20 minutes.
By accessing this page, you agree to the Privacy Policy and Terms Of Service.


IntelligentValue Home
Close Window

DISCLAIMER

All content herein is issued solely for informational purposes and is not to be construed as an offer to sell or the solicitation of an offer to buy, nor should it be interpreted as a recommendation to buy, hold or sell (short or otherwise) any security.  All opinions, analyses, and information included herein are based on sources believed to be reliable, but no representation or warranty of any kind, expressed or implied, is made including but not limited to any representation or warranty concerning accuracy, completeness, correctness, timeliness or appropriateness. We undertake no obligation to update such opinions, analysis or information. You should independently verify all information contained on this website. Some information is based on analysis of past performance or hypothetical performance results, which have inherent limitations. We make no representation that any particular equity or strategy will or is likely to achieve profits or losses similar to those shown. Shareholders, employees, writers, contractors, and affiliates associated with ETFOptimize.com may have ownership positions in the securities that are mentioned. If you are not sure if ETFs, algorithmic investing, or a particular investment is right for you, you are urged to consult with a Registered Investment Advisor (RIA). Neither this website nor anyone associated with producing its content are Registered Investment Advisors, and no attempt is made herein to substitute for personalized, professional investment advice. Neither ETFOptimize.com, Global Alpha Investments, Inc., nor its employees, service providers, associates, or affiliates are responsible for any investment losses you may incur as a result of using the information provided herein. Remember that past investment returns may not be indicative of future returns.

Copyright © 1998-2017 ETFOptimize.com, a publication of Optimized Investments, Inc. All rights reserved.