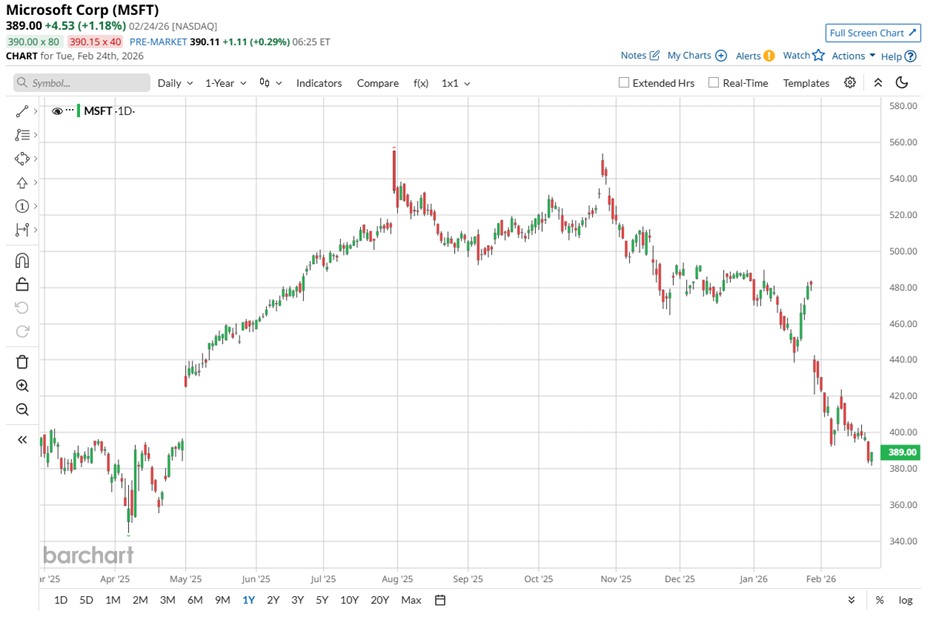
Microsoft Corporation (MSFT) stands among this year’s more sobering mega-cap stories. The stock has declined roughly 17.16% since the start of the year, a clear reminder that even artificial intelligence (AI) cannot suspend valuation gravity.
Still, the tape showed a flicker of resilience. Shares gained 1.2% on Tuesday, Feb. 24, after Microsoft unveiled a partnership with SpaceX’s Starlink to expand global internet access. The move signals pragmatic leadership. Despite Elon Musk’s public dispute with OpenAI, a partner backed by Microsoft, the company chose strategy over sentiment.
Musk reportedly demanded $134 billion in alleged “wrongful gains” tied to OpenAI’s evolution, escalating tensions with co-founder Sam Altman. Microsoft, however, kept its eye on the long game. It confirmed a collaboration among Microsoft, Starlink, and a Kenyan internet service provider to connect 540 community hubs nationwide.
By pairing low-Earth orbit satellite coverage with local deployment models, Microsoft extends Azure’s reach into underserved markets. Broader connectivity would accelerate digital adoption, embed Microsoft’s ecosystem early, and compound recurring revenue over time. On this note, let us see what stance to take on the stock.
About Microsoft Stock
Headquartered in Redmond, Washington, Microsoft develops enterprise and consumer software, cloud infrastructure, AI-powered productivity tools, business applications, and devices.
With a market cap of approximately $2.9 trillion, the company operates across productivity platforms, intelligent cloud services, and personal computing. Its ecosystem spans Azure, LinkedIn, enterprise software, Windows, gaming, and digital advertising.
Despite its celebrated alliance with OpenAI and its early leadership in machine learning, recent share performance reflects restraint. Over the past 52 weeks, MSFT stock has grown marginally at 0.68%. But year-to-date (YTD), the stock has declined 17.17%, with the drawdown deepening to 20.56% over six months and 14.03% in the past month alone.
From a valuation standpoint, MSFT stock is trading at 23.48 times forward adjusted earnings and 8.81 times sales. These multiples exceed industry averages, yet they sit below the company’s own five-year average multiples, suggesting a favorable entry point for long-term investors.
Plus, the company has increased its dividend for 21 consecutive years and pays $3.64 per share annually, yielding 0.94%. Its most recent quarterly dividend of $0.91 per share is scheduled to be paid on March 12 to shareholders of record as of Feb. 19.
Microsoft Surpasses Q2 Earnings
On Jan. 28, Microsoft unveiled its Q2 fiscal year 2026 earnings, owing to which the stock dropped nearly 10% the following day, despite headline beats. Revenue rose 16.7% year-over-year (YOY) to $81.3 billion, surpassing the $80.3 billion analyst estimate. Adjusted EPS rose nearly 24% from the year-ago value to $4.14, ahead of the Street’s $3.97 forecast.
However, the market focused on texture rather than totals. Gross margin narrowed to just over 68%, the lowest level in three years. Heavy investment in AI infrastructure and rising AI product usage weighed on profitability.
Efficiency gains in Azure and Microsoft 365 commercial cloud softened the blow, and operating margin improved to 47%, demonstrating firm cost control. Net income climbed to $38.46 billion, reinforcing the company’s scale advantage.
During the quarter, Microsoft Cloud revenue exceeded $50 billion for the first time, signaling sustained adoption of AI-driven services and platform expansion. Still, elevated capital expenditures and uneven signals from the personal computing segment unsettled investors.
Looking forward, management projects continued traction from Microsoft 365 Copilot, GitHub Copilot, and AI-integrated business tools. Meanwhile, analysts expect fiscal Q3 2026 EPS to increase 17.1% YOY to $4.05. For full-year fiscal 2026, they project 20% growth to $16.37, followed by a 14.4% rise to $18.72 in fiscal 2027.
What Do Analysts Expect for Microsoft Stock?
Analysts have trimmed price targets, yet they have not abandoned conviction. Citigroup lowered its price target for MSFT stock from $660 to $635. Even so, it maintains a “Buy” rating, acknowledging near-term recalibration without challenging the long-term thesis.
On the other hand, DA Davidson analyst Gil Luria has reiterated a “Buy” rating and a $650 price target following the second-quarter results, pointing to resilient top and bottom line performance.
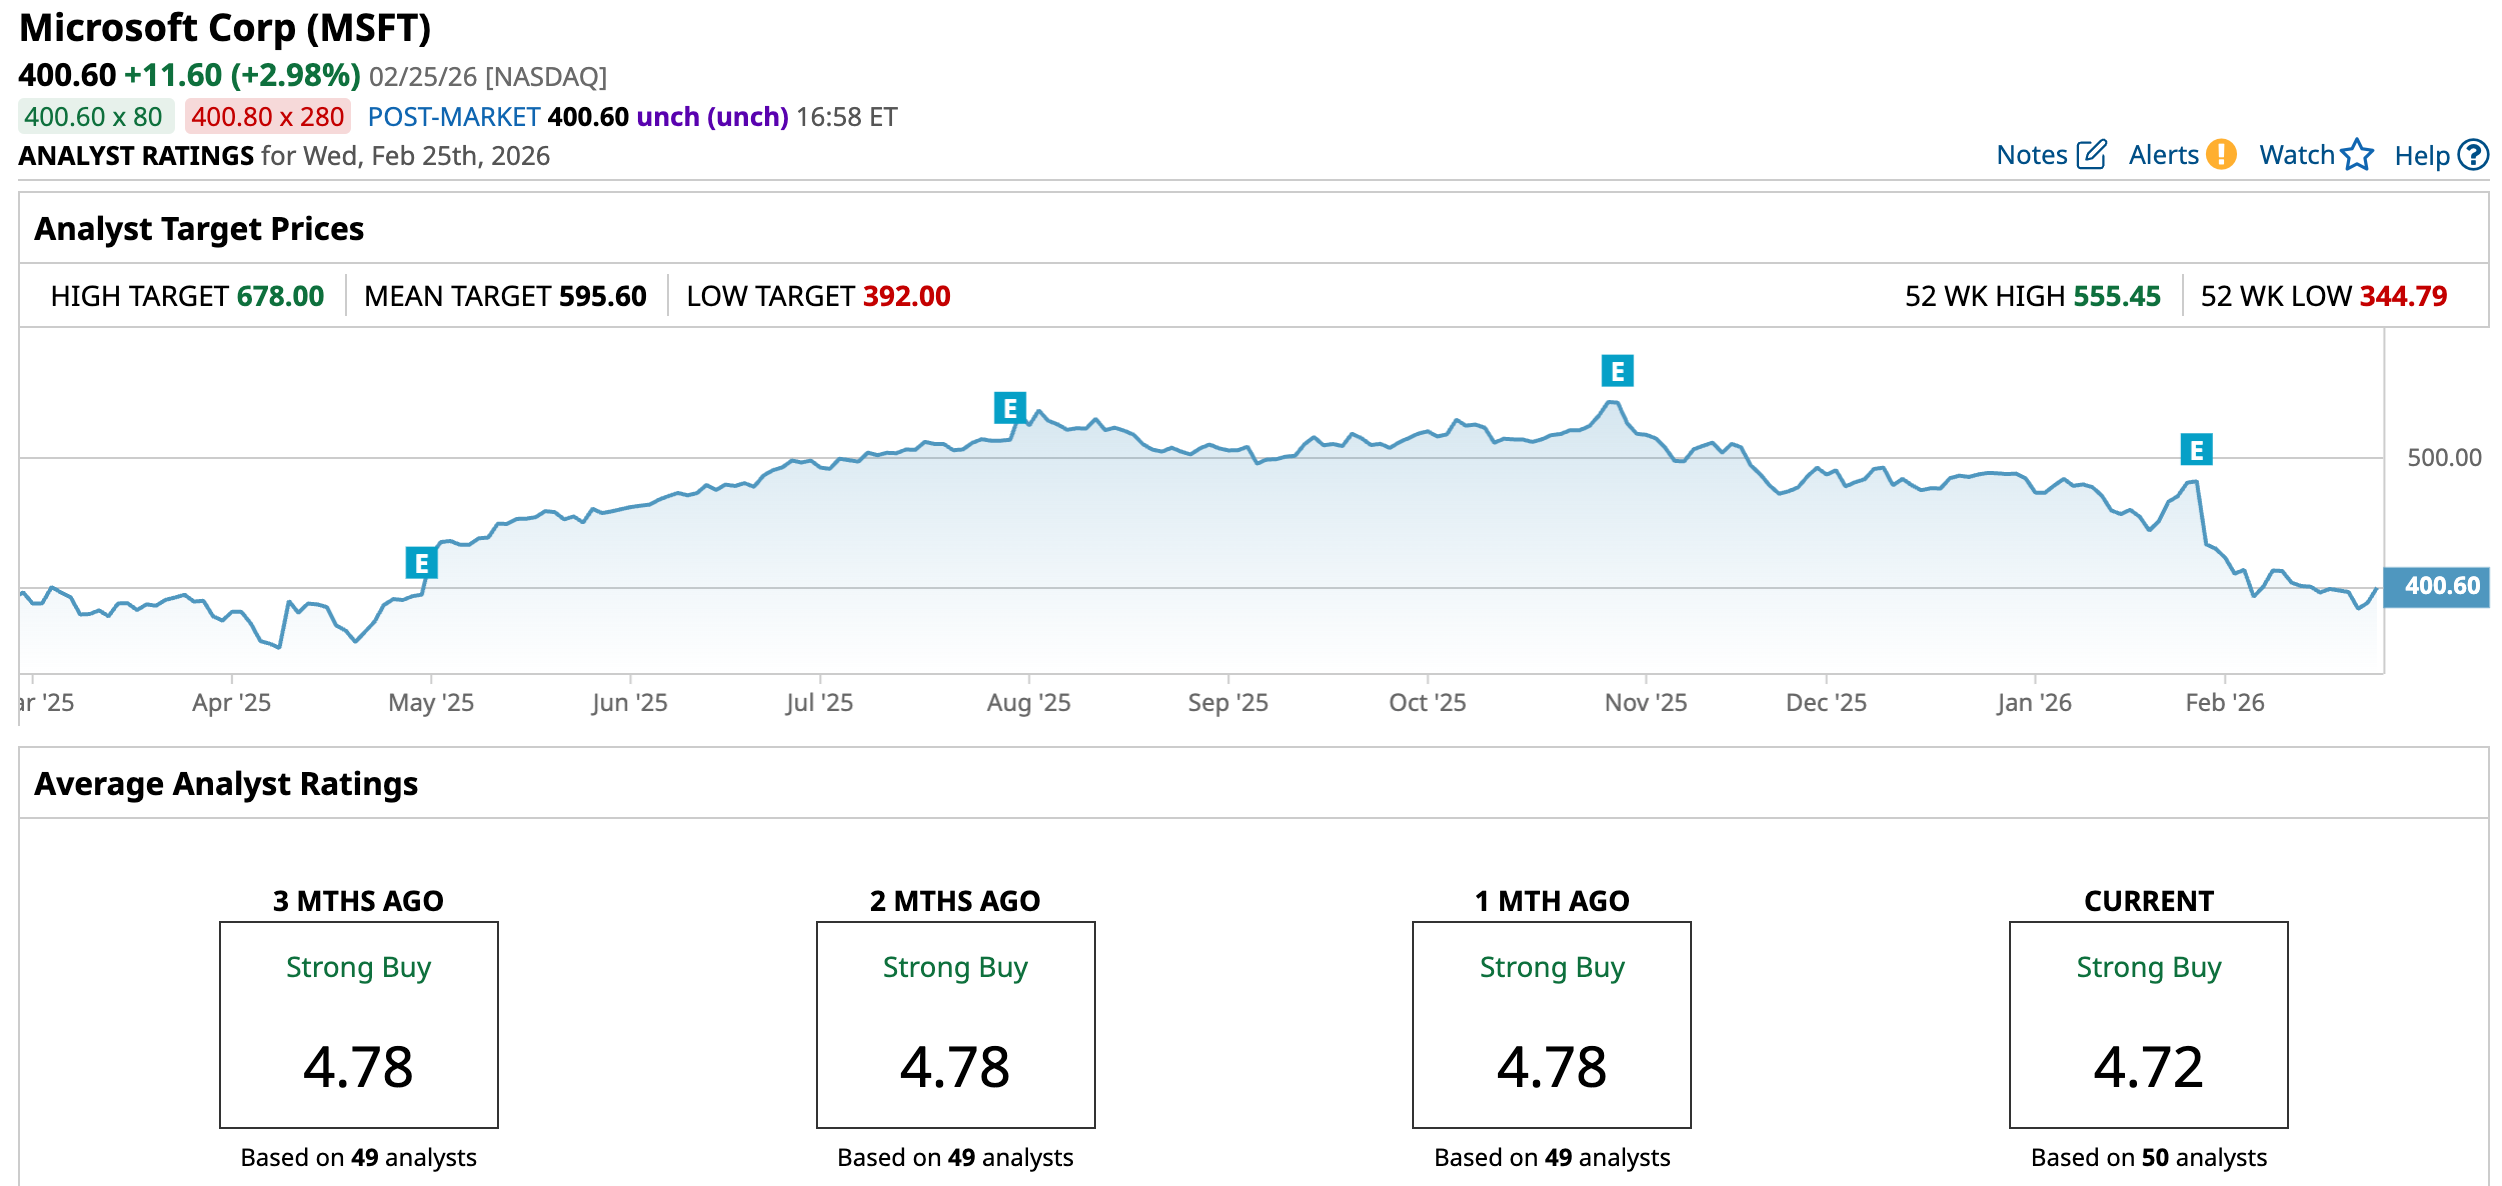
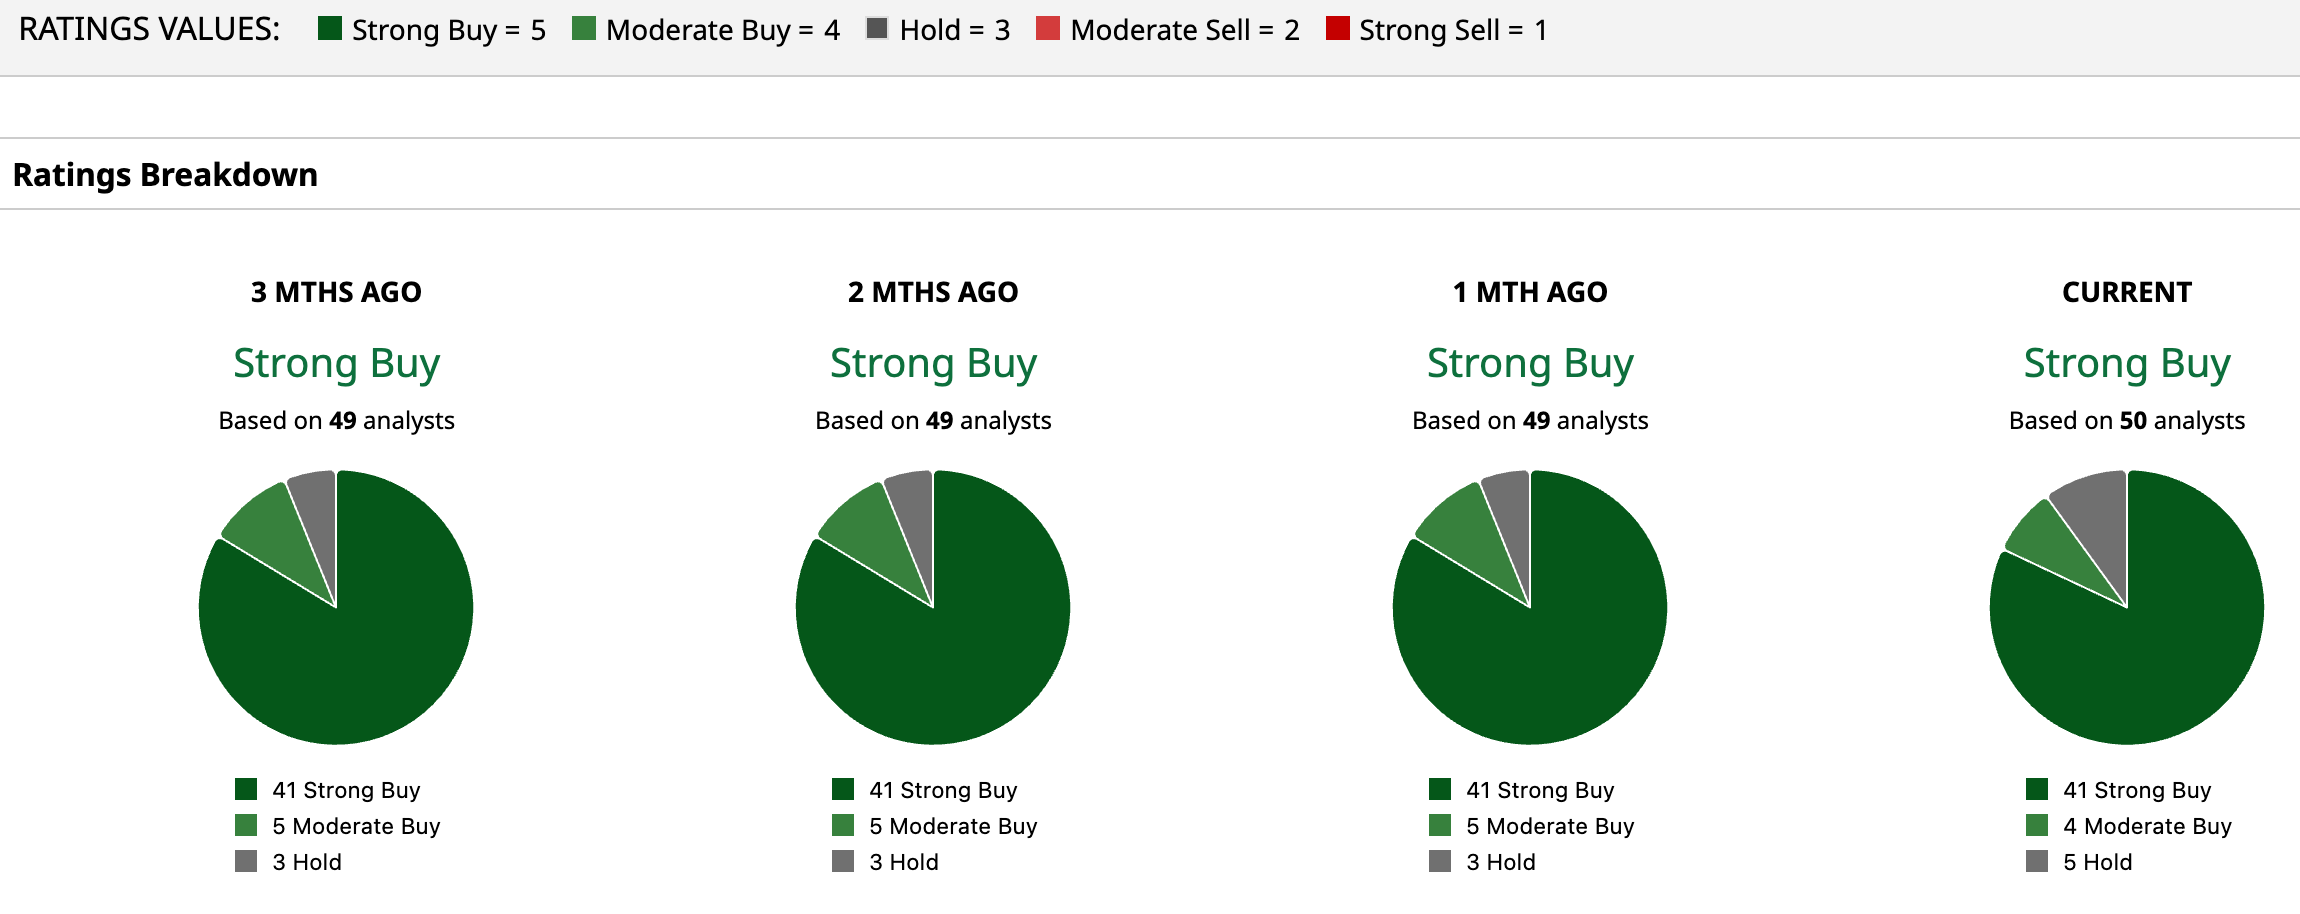
Wall Street currently assigns MSFT stock an overall “Strong Buy” rating. Out of 50 analysts, 41 rate it a “Strong Buy,” four have assigned a “Moderate Buy,” and five recommend “Hold.”
To that end, the average price target of $595.60 implies potential upside of 48.7%. Meanwhile, the Street-high target of $678 points to a possible gain of 69.3% from current levels.
On the date of publication, Aanchal Sugandh did not have (either directly or indirectly) positions in any of the securities mentioned in this article. All information and data in this article is solely for informational purposes. For more information please view the Barchart Disclosure Policy here.
More news from Barchart
- A Transformation Is Underway in Opendoor Stock. Should You Chase the Rally Here?
- This High-Yield Dividend Stock Is Powering a New Generation of Data Centers
- Director Stanton John Just Bought $2 Million of Microsoft Stock. Should You Buy MSFT Too?
- 1 Internet of Things Stock That Just Hit New All-Time Highs