With a market cap of $81.6 billion, Synopsys, Inc. (SNPS) is a leading provider of design automation and design IP solutions for the semiconductor and electronics industries. It also offers pre-verified, silicon-proven IP solutions including processors, security IP, SoC infrastructure, and automotive-focused offerings.
Companies valued at more than $10 billion are generally considered “large-cap” stocks, and Synopsys fits this criterion perfectly. Operating through its Design Automation and Design IP segments, the company delivers advanced tools for digital and custom IC design, verification, FPGA design, TCAD, manufacturing analytics, and AI-driven electronic design automation (EDA).
Despite this, shares of the Sunnyvale, California-based company have decreased 35.4% from its 52-week high of $651.73. SNPS stock has increased nearly 4% over the past three months, outpacing the State Street Technology Select Sector SPDR ETF's (XLK) marginal decline over the same time frame.
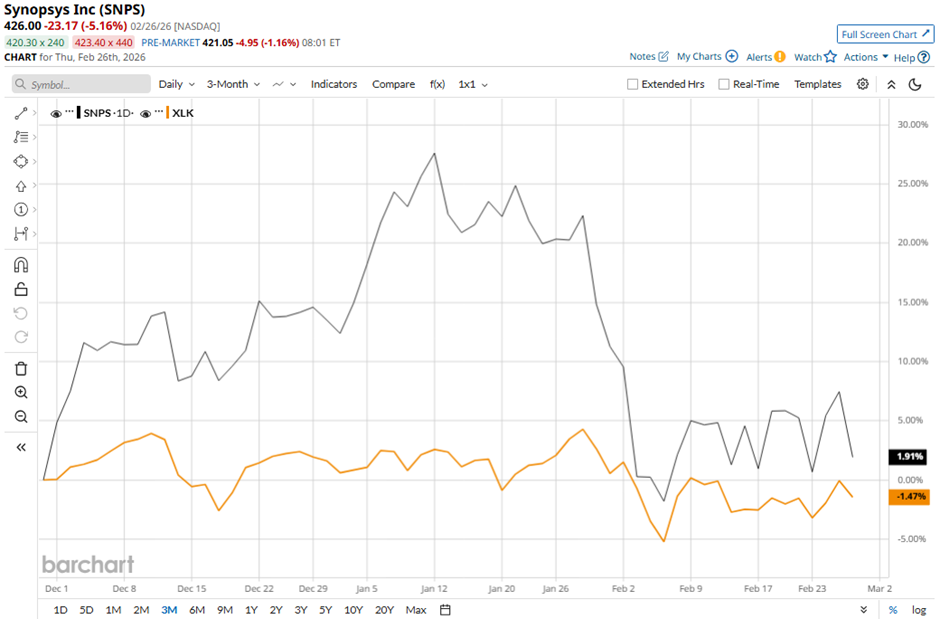
SNPS stock is down 9.3% on a YTD basis, underperforming XLK’s 2.1% drop. Moreover, in the longer term, shares of Synopsys have declined 9.5% over the past 52 weeks, compared to XLK’s 22.1% gain over the same time frame.
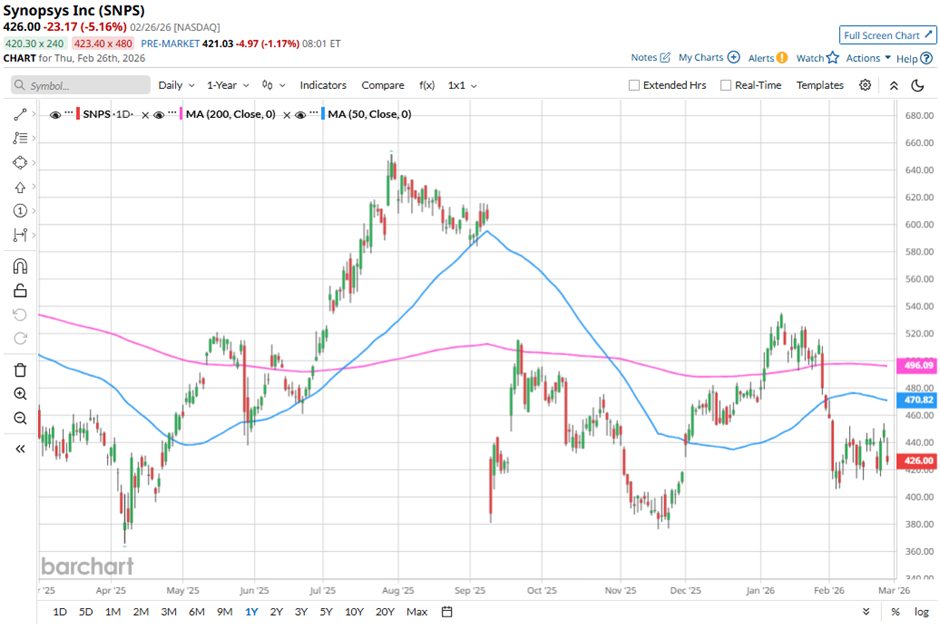
Despite recent fluctuations, the stock has been trading mostly below its 50-day and 200-day moving averages since September 2025.
Shares of Synopsys fell 5.2% following its Q1 2026 results on Feb. 25, as investors reacted to full-year revenue guidance that came in slightly below expectations despite strong quarterly performance. Although Q1 revenue surged 65% year-over-year to $2.41 billion and adjusted EPS beat estimates at $3.77, the fiscal 2027 revenue guidance midpoint of $9.61 billion missed the consensus.
In comparison, SNPS stock has shown a less pronounced decline than its rival Microsoft Corporation (MSFT), falling 16.9% on a YTD basis. However, MSFT stock has gained marginally over the past 52 weeks, outpacing SNPS stock.
Despite the stock’s underperformance over the past year, analysts remain moderately optimistic on Synopsys. The stock has a consensus rating of “Moderate Buy” from 21 analysts in coverage, and the mean price target of $555 suggests 30.3% upside potential from current price levels.
On the date of publication, Sohini Mondal did not have (either directly or indirectly) positions in any of the securities mentioned in this article. All information and data in this article is solely for informational purposes. For more information please view the Barchart Disclosure Policy here.
More news from Barchart
- As Uber Buys SpotHero, Should You Buy, Sell, or Hold UBER Stock?
- Sam Altman Casts Doubt on Space-Based Data Centers, But This 1 Hot Stock Is Determined to Make Them a Reality
- 1 Dividend Stock to Buy Now If You Are Still Betting on Data Center Demand
- With Bearish Overhangs in the Rearview Mirror, CrowdStrike (CRWD) Stock Looks Tempting


