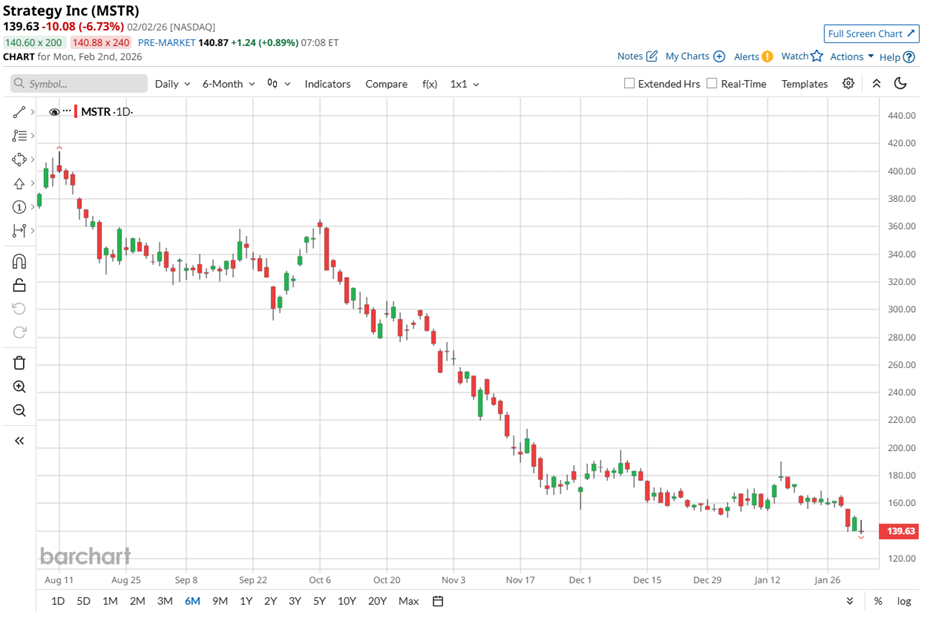
The second half of January delivered a harsh reality check for bitcoin development company Strategy (MSTR) as its shares slid sharply and reignited doubts about its ability to outperform over the long run. The stock is now trading nearly 72% below its 52-week high, reflecting the eroding confidence.
The loss of faith accelerated as Bitcoin (BTCUSD) fell decisively below the $80,000 level, a key psychological threshold and the estimated cost base for many spot ETFs. The breakdown triggered broad risk aversion, prompting investors to abandon high-beta Bitcoin proxies such as Strategy.
Selling pressure intensified amid a wider deleveraging event and shifting macro expectations after President Donald Trump nominated Kevin Warsh as the next Federal Reserve chair. Warsh’s hawkish reputation revived fears of a higher-for-longer rate regime, threatening liquidity and weighing further on speculative, rate-sensitive assets.
The resulting selloff has once again pushed Strategy’s market cap below its net asset value, leaving the stock trading at a discount to the market value of its sizable Bitcoin holdings. This has set the stage to examine whether the dislocation now presents an attractive entry point.
About Strategy Stock
Formerly known as MicroStrategy, Tysons Corner, Virginia-based Strategy is the world’s first and largest Bitcoin Treasury Company. With a market cap near $43 billion, it also delivers cloud-native, artificial intelligence (AI)-powered enterprise analytics software through its Strategy ONE platform, which unifies data access, governance, analytics, and AI-driven workflows.
The stock’s recent performance reflects mounting pressure. Over the last six months, MSTR stock has dropped 63.78%, while the past three months alone delivered a 49.83% plunge. In just the past five trading sessions, shares slid another 17.82%, highlighting persistent selling momentum and fragile investor sentiment.
Moreover, MSTR stock is currently trading at 95.11 times sales. The figure towers well above industry averages of 3.45 times, signaling a hefty premium.
A Closer Look at Strategy’s Q3 Earnings
On Oct. 30, 2025, Strategy unveiled its Q3 2025 results, wherein revenue rose 10.9% year-over-year (YOY) to $128.7 million, comfortably beating Street expectations of $118 million. However, EPS landed at $8.42, falling short of analyst estimates of $9.67.
Despite the EPS miss, profitability improved dramatically. Strategy swung from a loss of $1.72 per share in the prior-year quarter to solid profitability, driven largely by paper gains on its Bitcoin holdings. Those holdings expanded to 640,808 BTC, materially amplifying balance-sheet sensitivity to Bitcoin price movements.
Income from operations surged to $3.9 billion, reversing a $432.6 million loss reported a year earlier. Net income reached $2.8 billion, compared with a $340.1 million net loss in the prior-year quarter. Moreover, as of Oct. 26, 2025, the company generated a BTC Yield of 26% and a BTC $ gain of $12.9 billion.
Additionally, Strategy is laying the groundwork to issue credit securities across international jurisdictions, positioning itself as a potentially dominant global credit issuer. With this momentum, management has reaffirmed full-year 2025 targets of a $20 billion BTC dollar gain and a 30% BTC Yield.
Furthermore, they project operating income near $34 billion, net income of approximately $24 billion, and diluted earnings of around $80 per share for the year, assuming Bitcoin reaches $150,000 by year-end 2025.
The company is scheduled to report its Q4 2025 financial results after market close on Thursday, Feb. 5. Analysts expect the quarter’s loss per share to grow 464.4% YOY to $18.06. For the full fiscal year 2025, loss per share is projected to widen 359.2% from the prior year to $30.86, with losses later narrowing 32.3% to $20.87 in fiscal year 2026.
What Do Analysts Expect for Strategy Stock?
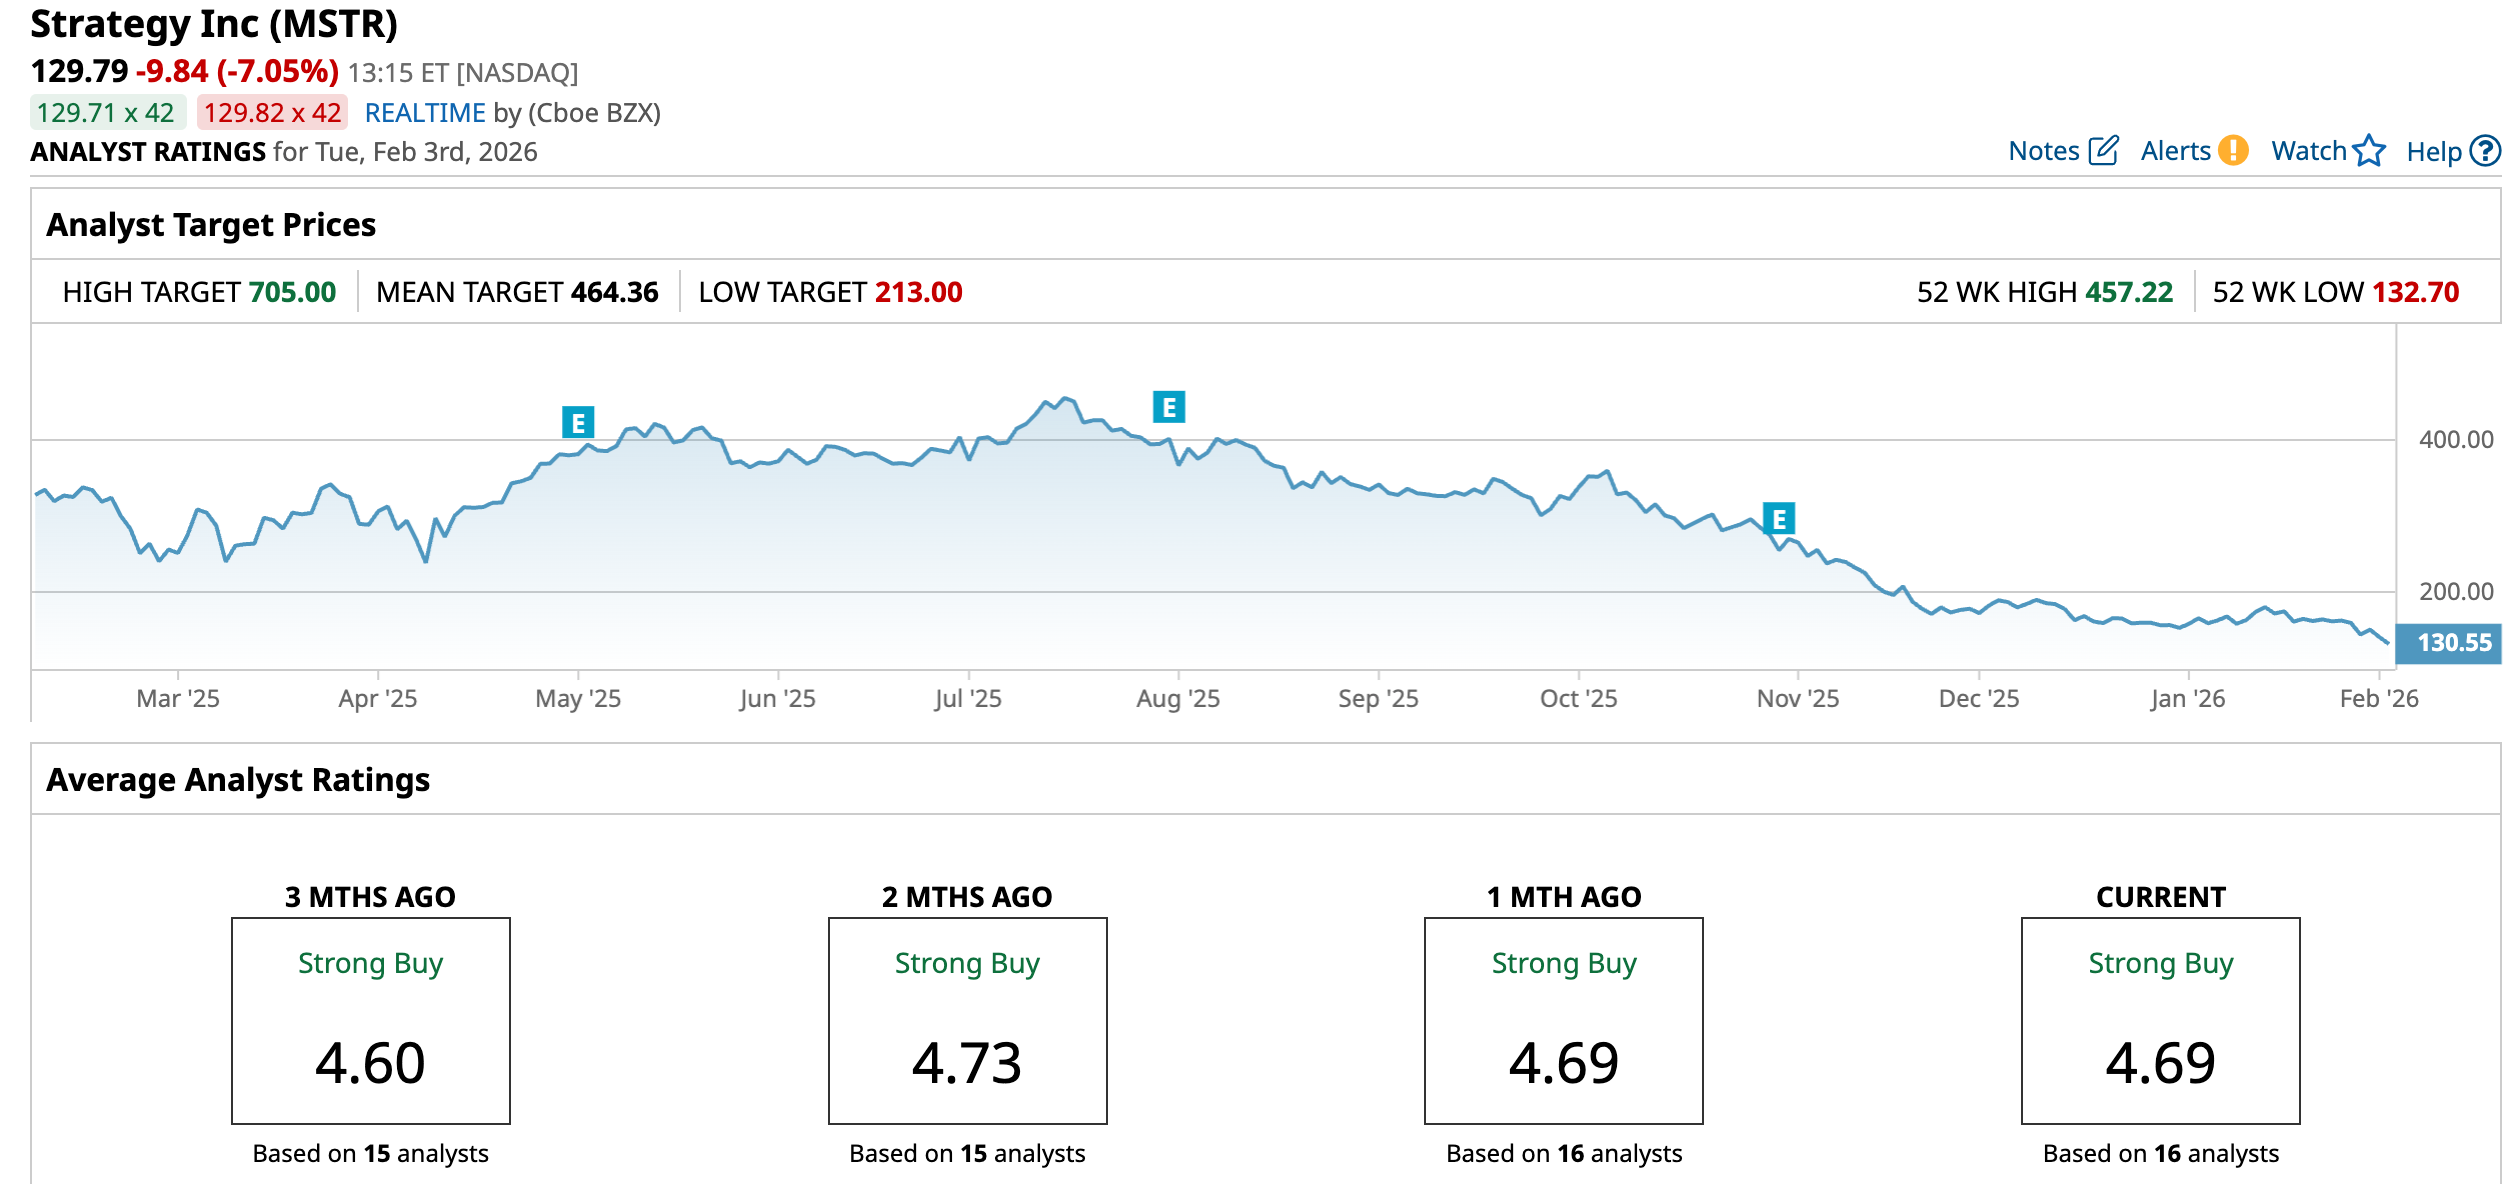
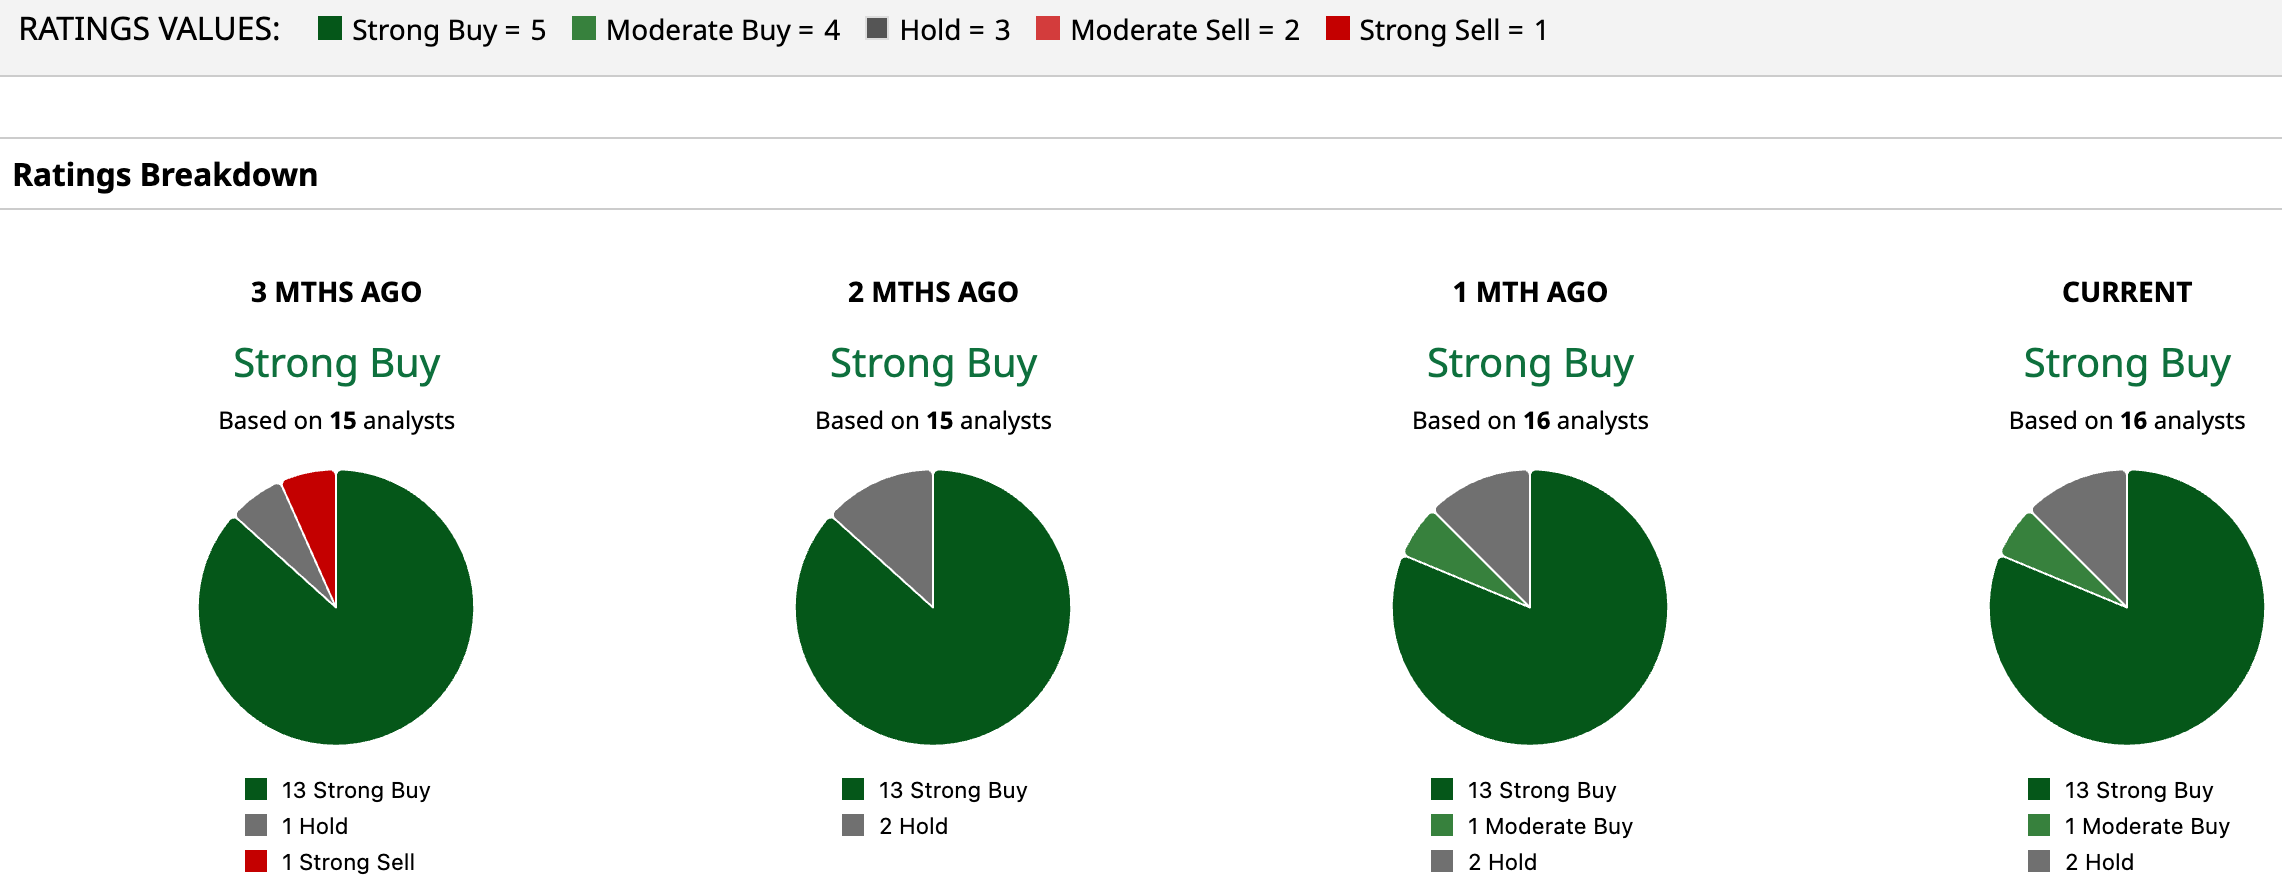
Wall Street remains broadly optimistic despite near-term turbulence. MSTR stock is carrying an overall “Strong Buy” rating. Among 16 analysts, 13 recommend “Strong Buy,” one suggests “Moderate Buy,” and two advise “Hold,” indicating confidence in Strategy’s long-term Bitcoin-leveraged model.
The average price target of $464.36 implies potential upside of 257.8%, whereas the Street-high target of $705 suggests a gain of 443.2% from current levels.
On the date of publication, Aanchal Sugandh did not have (either directly or indirectly) positions in any of the securities mentioned in this article. All information and data in this article is solely for informational purposes. For more information please view the Barchart Disclosure Policy here.
More news from Barchart